What Are Support and Resistance in Trading?
Understanding Support and Resistance in Trading
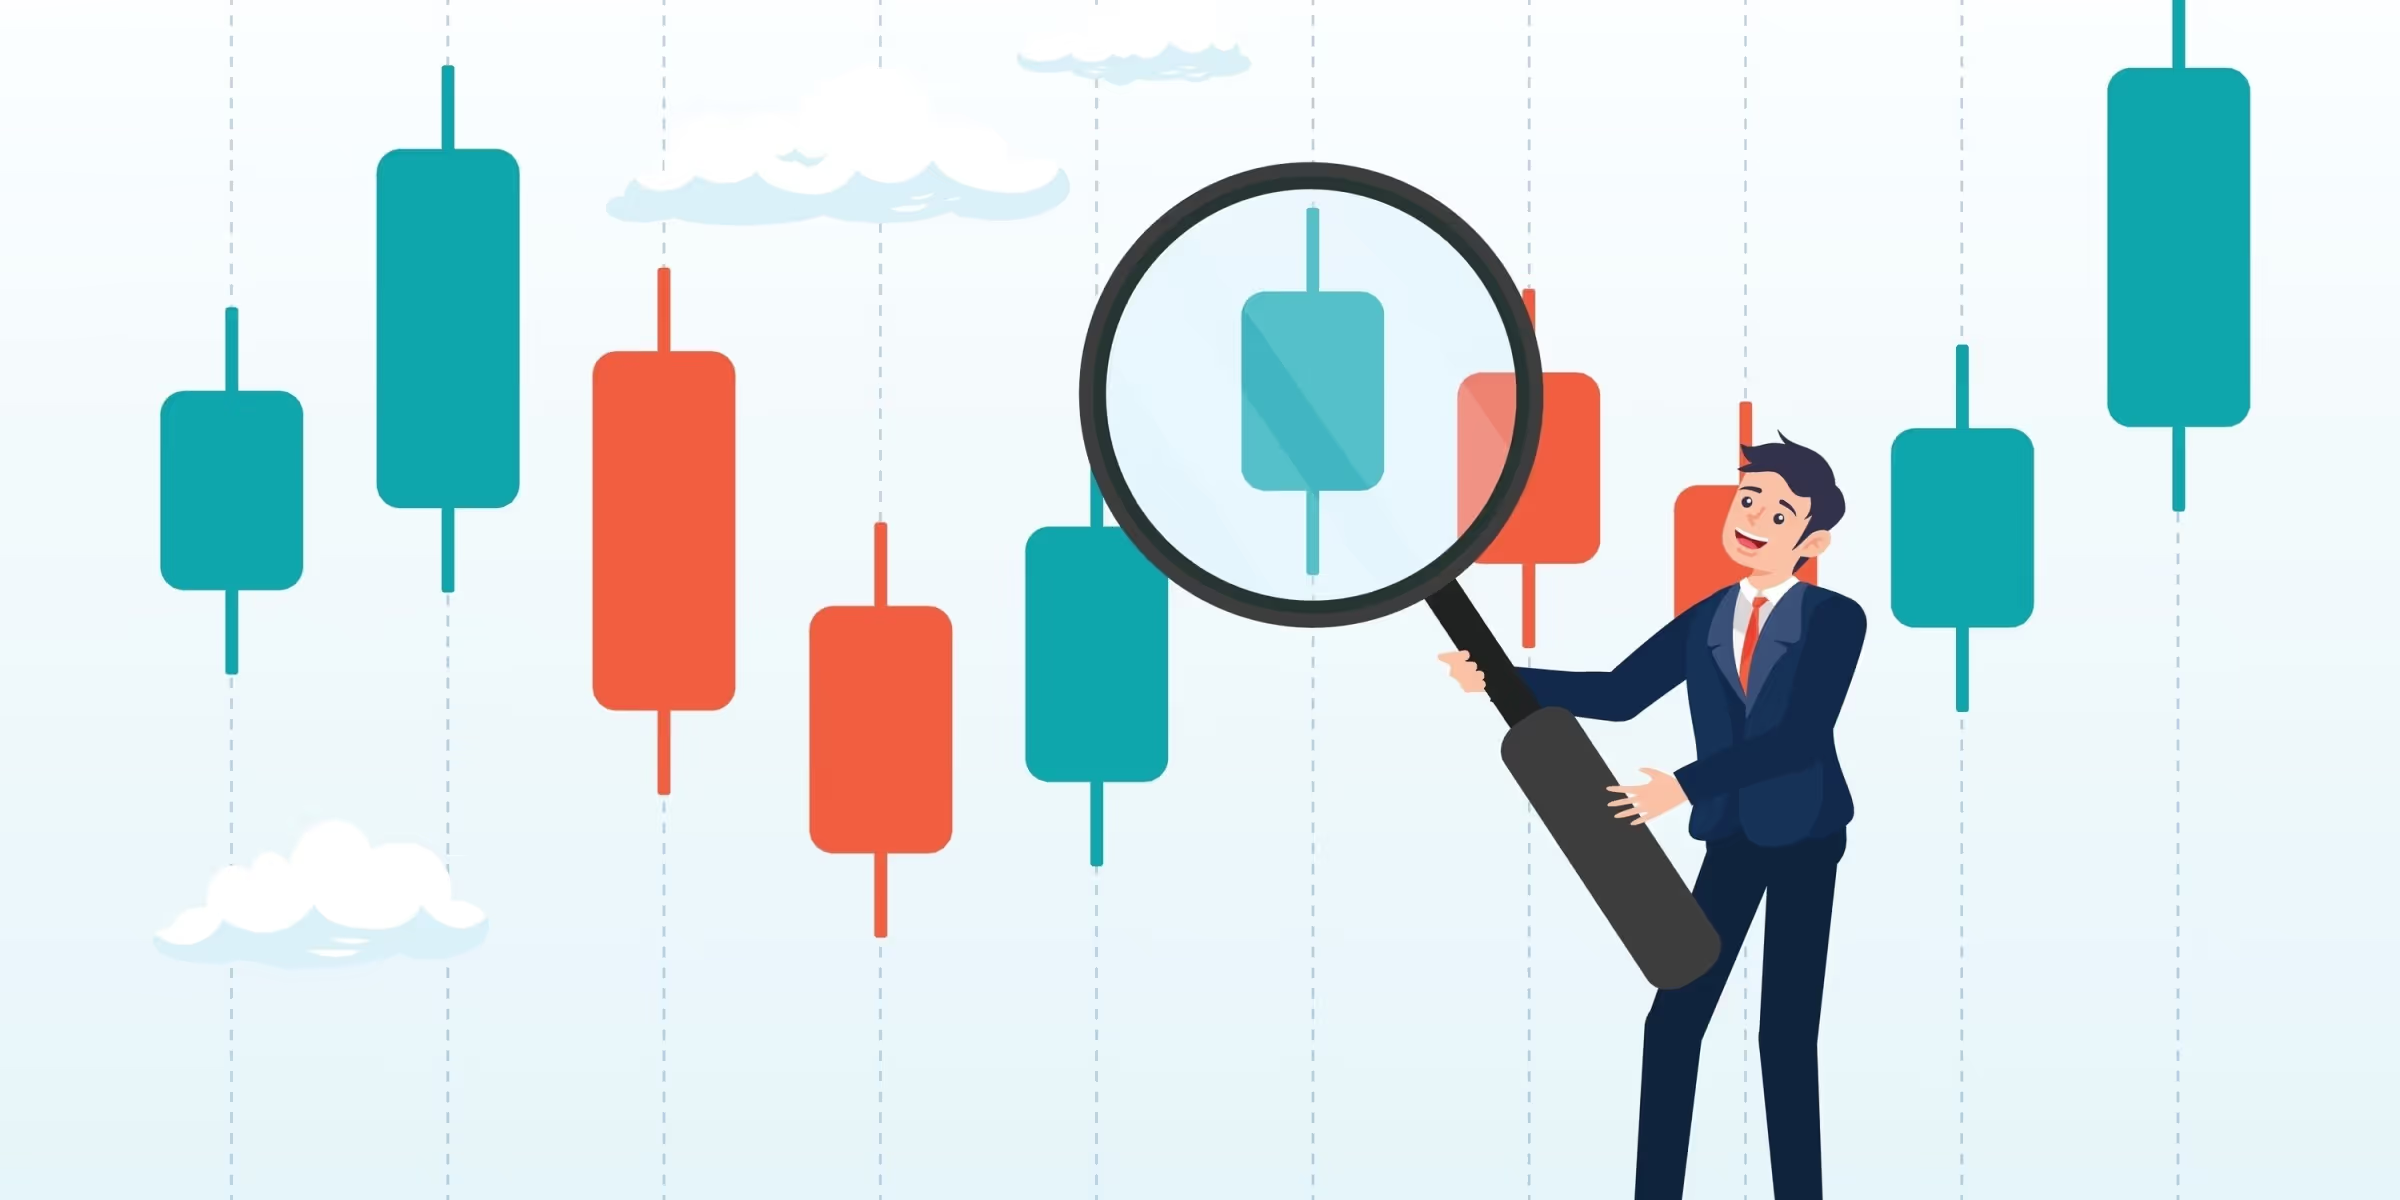
If you've spent any time around technical analysis, you've probably heard the terms "support" and "resistance" thrown around constantly. And for good reason — these two concepts sit at the very heart of how traders read charts, no matter what market they're dealing with. Stocks, forex, crypto, commodities — it doesn't matter. Support and resistance show up everywhere.
But here's what makes this topic genuinely interesting: it's not really about charts, lines, or indicators. At its core, it's about people. About the way humans make decisions when money is on the line, when fear kicks in, and when greed takes over. Understanding that the human element is what separates traders who use these levels effectively from those who don't.
And the funny thing is, you already understand the logic behind support and resistance. You've lived it, probably without ever calling it that.
Why We Behave Differently in Markets
Think about how you shop. When something goes on sale, you're more likely to buy it. When prices shoot up, you hesitate or walk away. That instinct — seeking value, avoiding overpaying — is deeply wired into us.
In financial markets, though, most people do the exact opposite.
When prices drop, instead of seeing opportunity, many traders feel dread. What if it keeps falling? When prices spike upward, instead of being cautious, they feel urgency — a fear of being left behind. This is FOMO in its purest form, and it's responsible for many bad trades: buying near the top, selling near the bottom, repeating the cycle.

Fear and greed are relentless. And they're why so many traders struggle to find consistency.
Skilled traders learn to step back from that emotional current. Rather than reacting to price moves, they focus on identifying specific areas on the chart where institutional participants are likely to be active — where meaningful buying or selling is probable. Those areas are what we call support and resistance.
A Simple Analogy That Actually Works
Imagine you walk into a store and see a video game you've been eyeing for months. Normally it's $70, but today it's marked down to $20. You grab it without thinking twice. Of course you do.
Now picture the same game priced at $120. Even if you want it, you probably hesitate. Maybe you decide to wait. Maybe you pass altogether.
That's support and resistance in a nutshell.
Support is a price area where buyers see value and step in. Resistance is where sellers feel the price has gone too far and start pushing back.

In financial markets, this plays out on a massive scale. Thousands — sometimes millions — of participants are making these decisions at the same time. When enough of them agree that a price looks attractive, buying pressure builds, and the price stops falling. That's a support level forming. When enough of them think the price has gotten too expensive, selling kicks in, and the upward move stalls. That's resistance.
What This Looks Like on a Chart
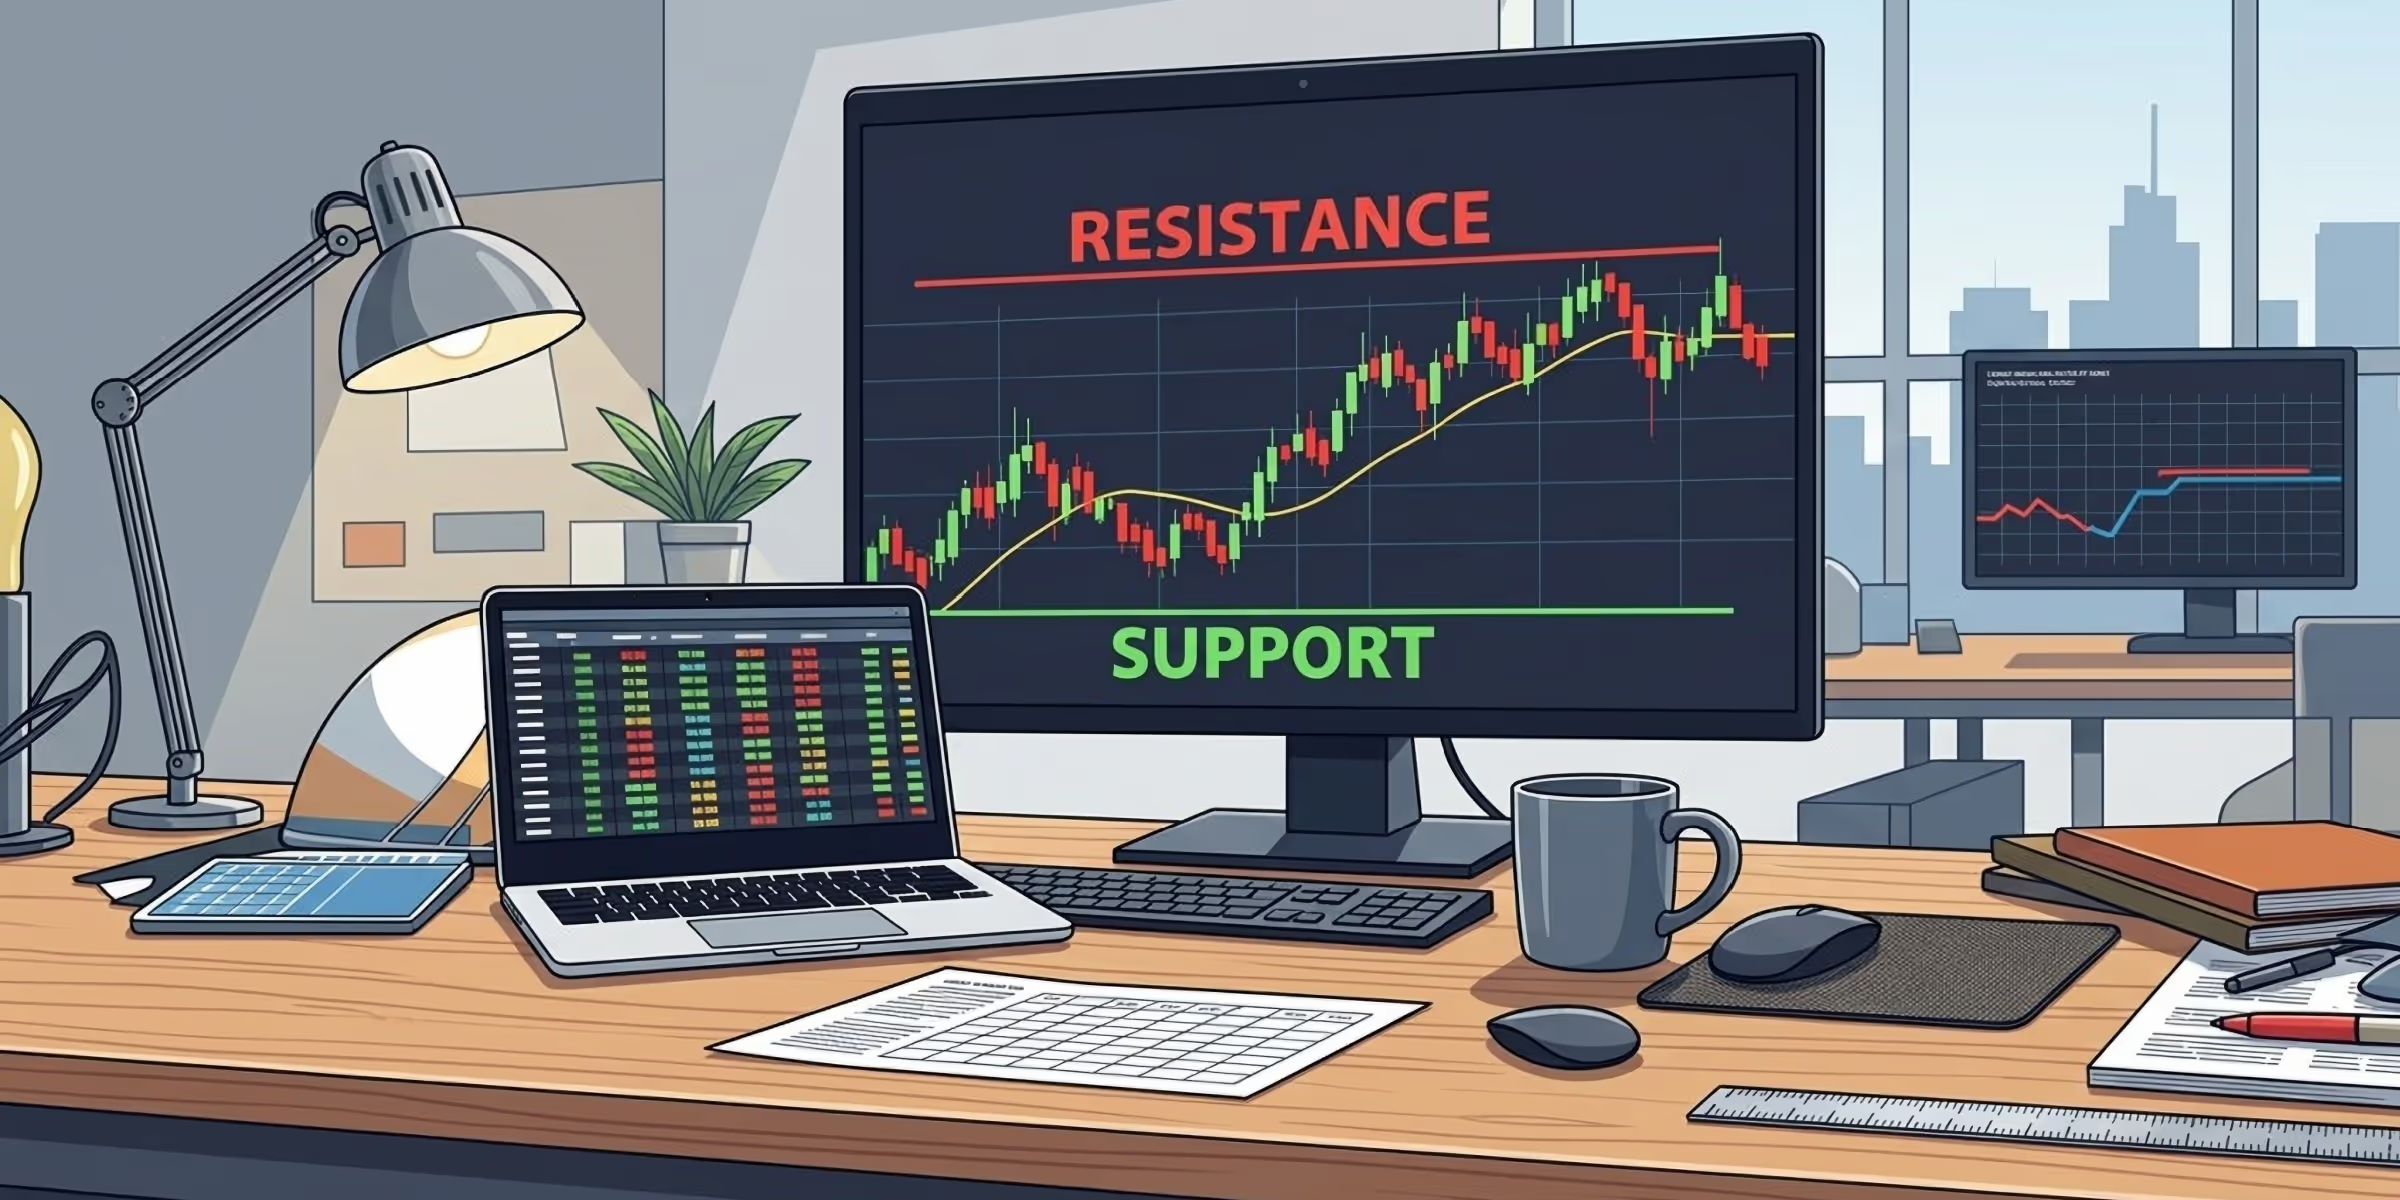
On a price chart, support acts like a floor, and resistance acts like a ceiling. But it's not rigid. Think of it more as a zone the price tends to react around, rather than a hard line it can't cross.
When price approaches a support area, buyers tend to get more active, sellers ease off, and price often stabilizes or bounces higher. At resistance, it's the reverse — sellers become more aggressive, buyers lose conviction, and the price frequently stalls or turns lower.

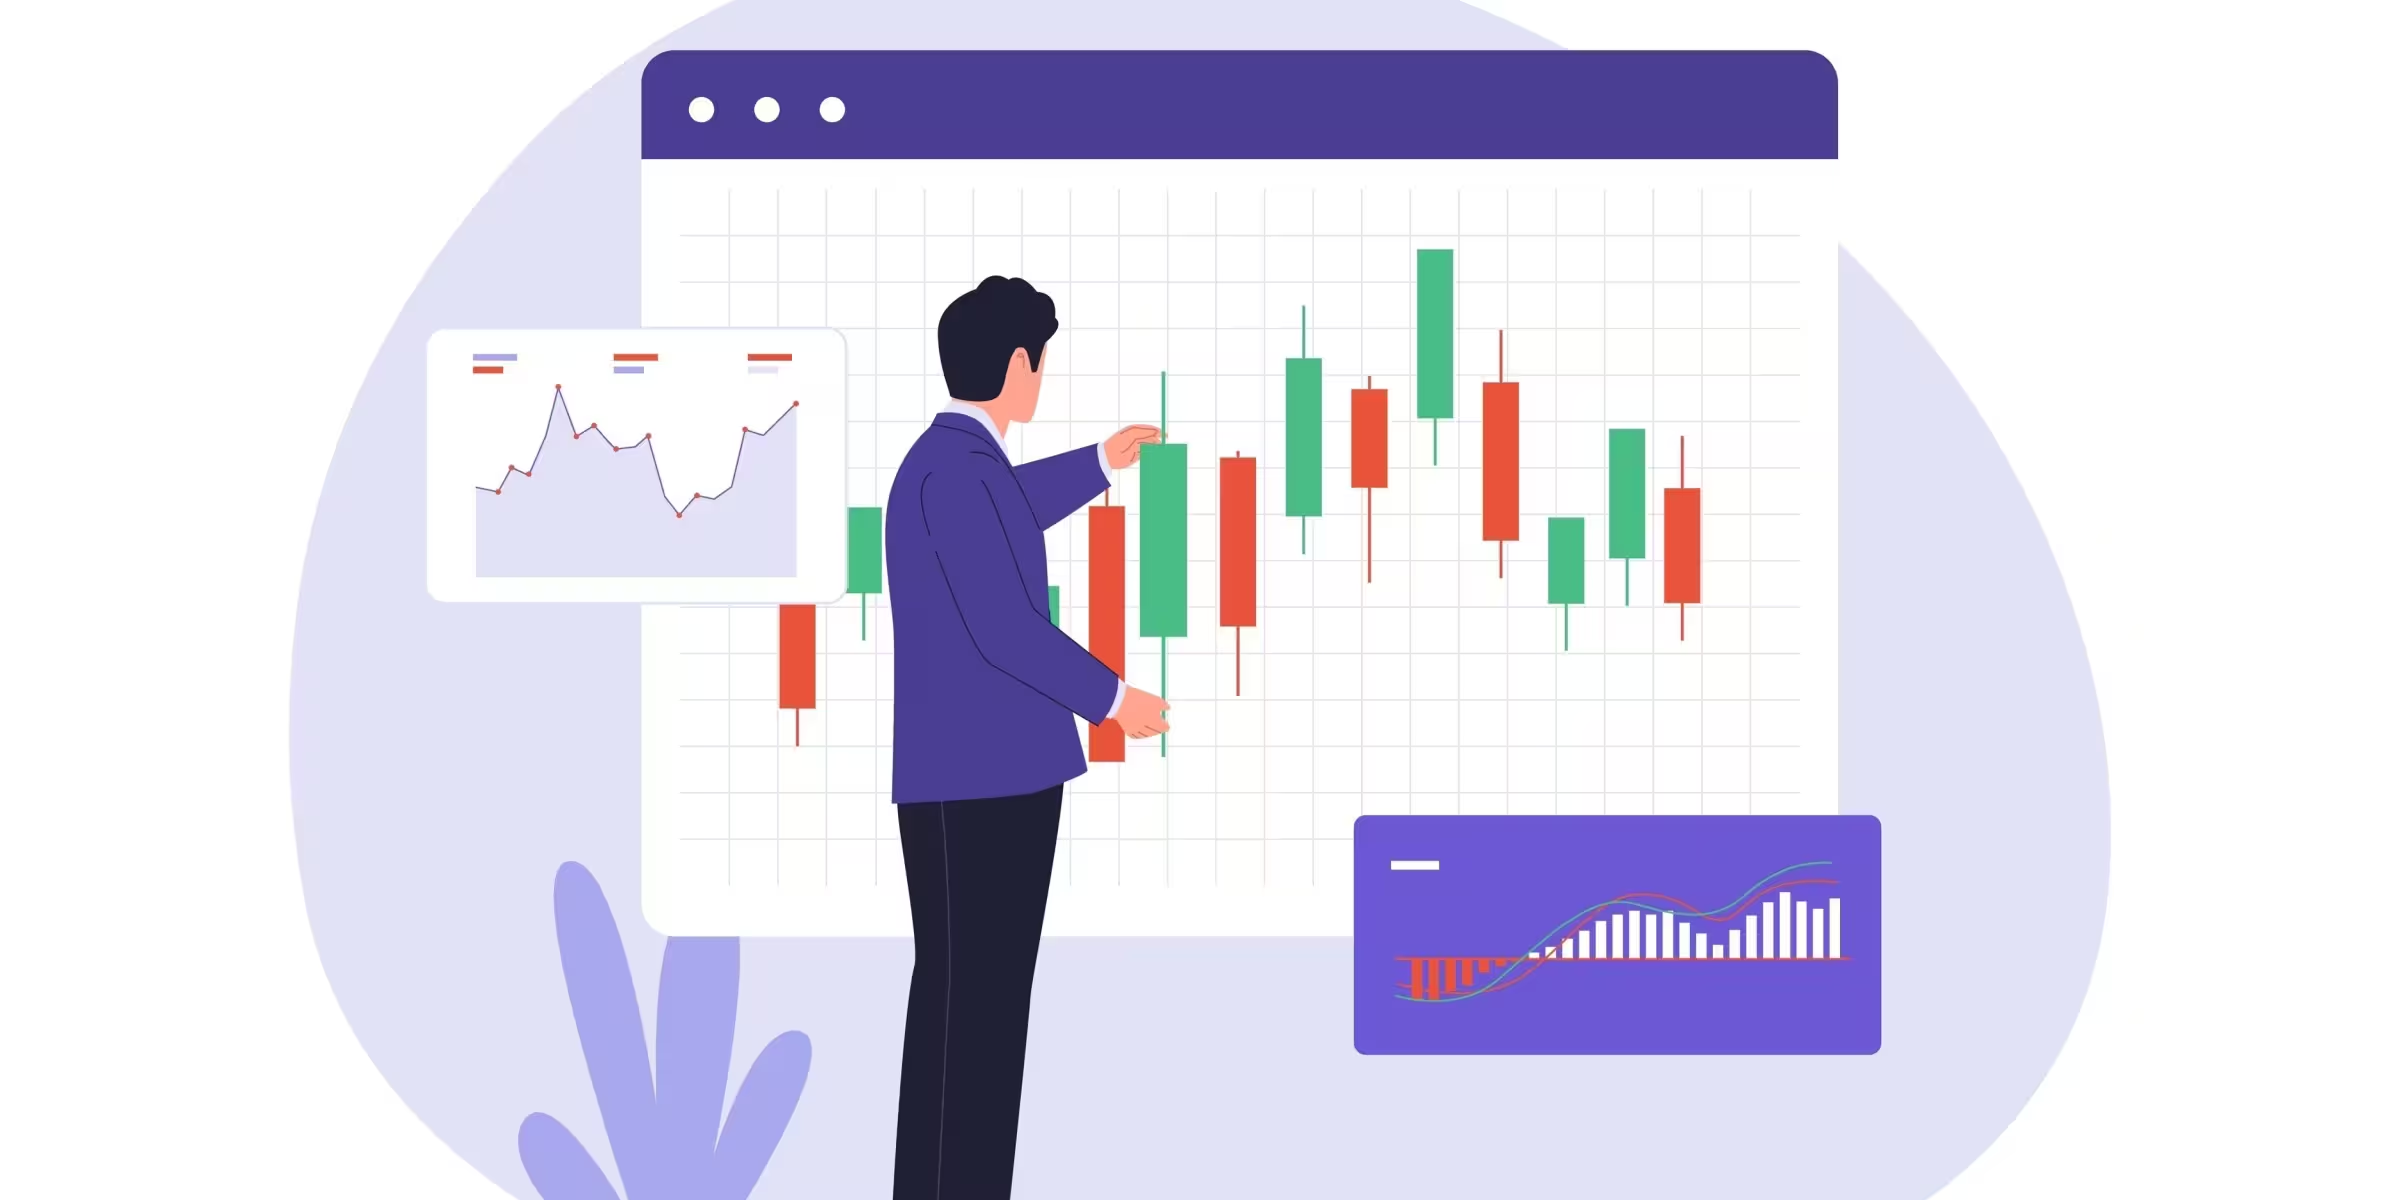
These reactions create the wave-like patterns you see on any chart. They're not random noise. They reflect the ongoing tug-of-war between buyers (bulls) and sellers (bears).
The practical takeaway: Bulls want to buy near support and take profits near resistance. Bears want to sell near resistance and cover their positions near support. Once you understand that rhythm, price action starts to make a lot more sense.
The Psychology Driving It All
Markets run on three emotions more than anything else: fear, greed, and regret.
Professional traders tend to feel an opportunity when the price falls toward support. They see a discount. The general public, meanwhile, often feels anxiety — worried that prices will keep dropping, spooked by negative headlines. At resistance, experienced traders grow cautious and start thinking about exits. Retail traders, ironically, often feel most excited right as prices reach overextended levels, rushing in just as the move runs out of steam.
One other factor matters a lot here: memory.
Traders remember where things happened. If someone bought at a high price and watched it drop, they'll often sell the moment the price gets back to that level — just to get out even. If someone missed a buying opportunity at a lower level, they'll be waiting eagerly for the price to return there. These collective memories create self-fulfilling reactions at specific price zones, over and over again.
It's also worth noting that fear tends to hit harder than greed. That's why markets can collapse in days but take months to recover. Panic selling is fast. Accumulation is slow.
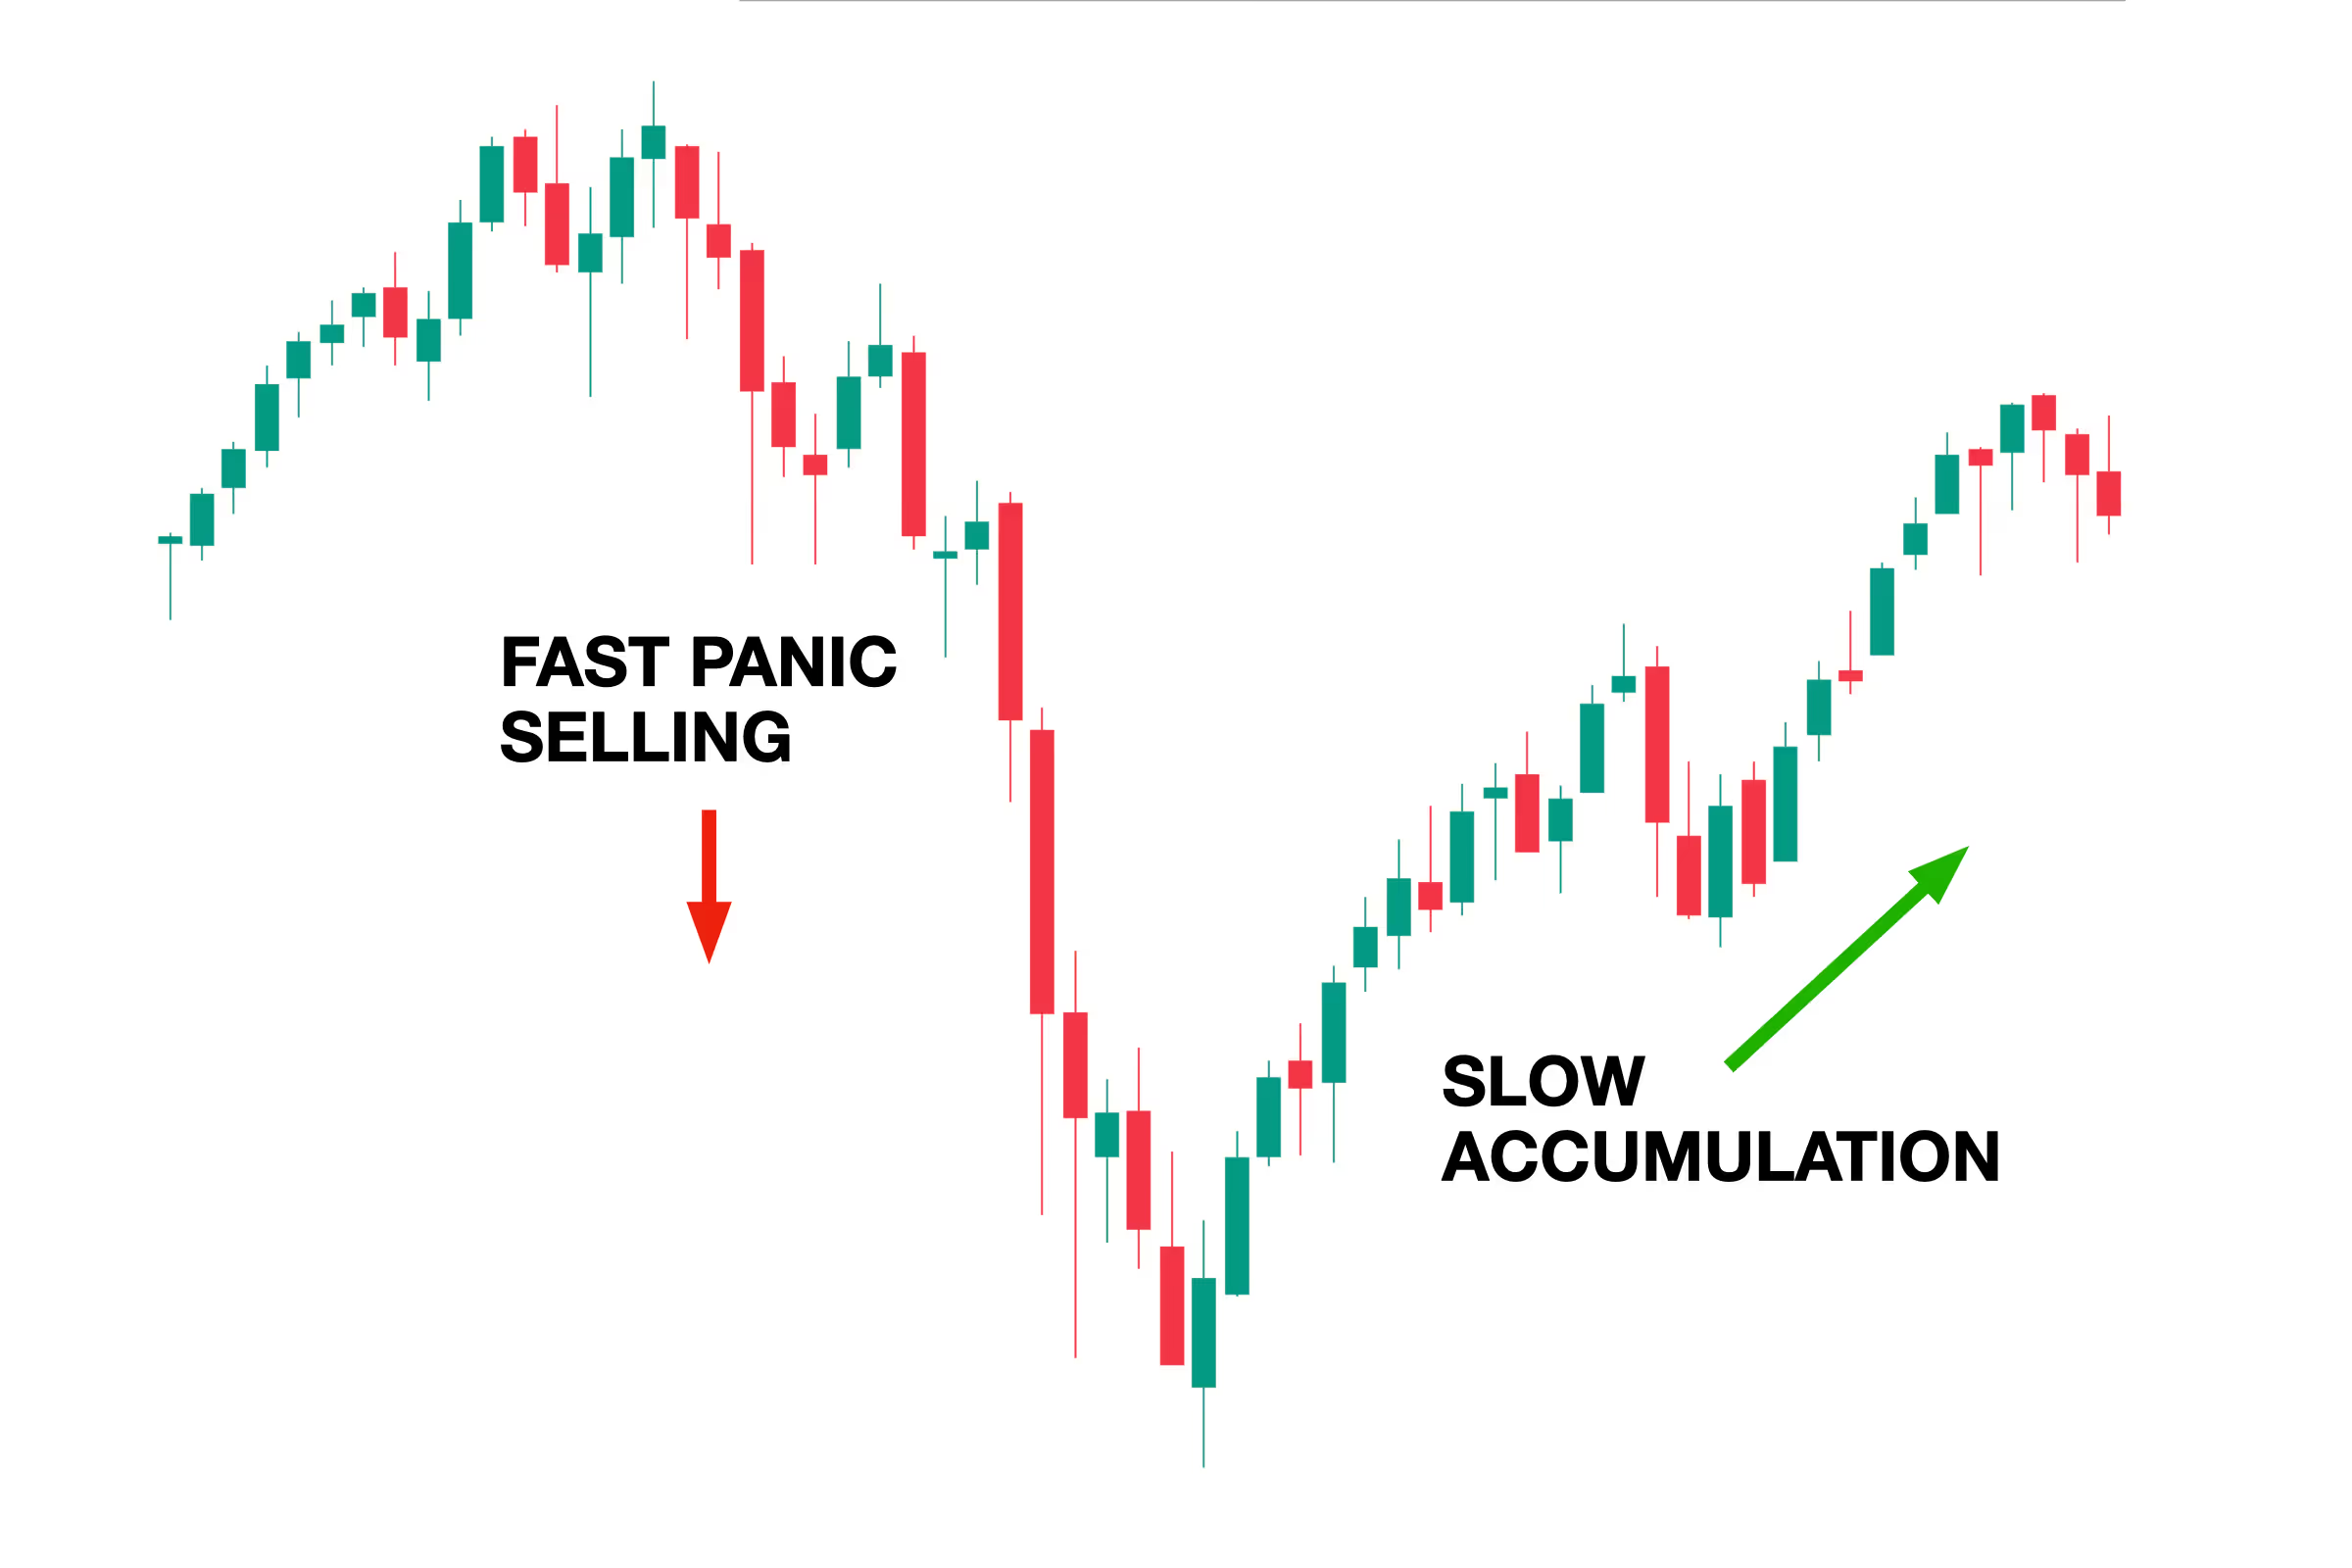
Knowing this helps you interpret sharp moves with more perspective.
How Support Levels Form
Support doesn't just appear out of nowhere. It develops through a specific sequence of events, and understanding that sequence helps you identify stronger levels.
During a market reversal, the process typically looks like this: a sharp selloff drives prices lower as fear spreads and stop-losses cascade. Buyers try to halt the drop but repeatedly fail. Eventually, though, the price reaches a level that long-term investors consider genuinely cheap, and institutional money starts to step in quietly. The market moves sideways for a while as selling pressure exhausts itself and buying gradually takes over. Then buyers take control, price breaks higher, and when it later returns to that zone and holds — that's your validated support level.
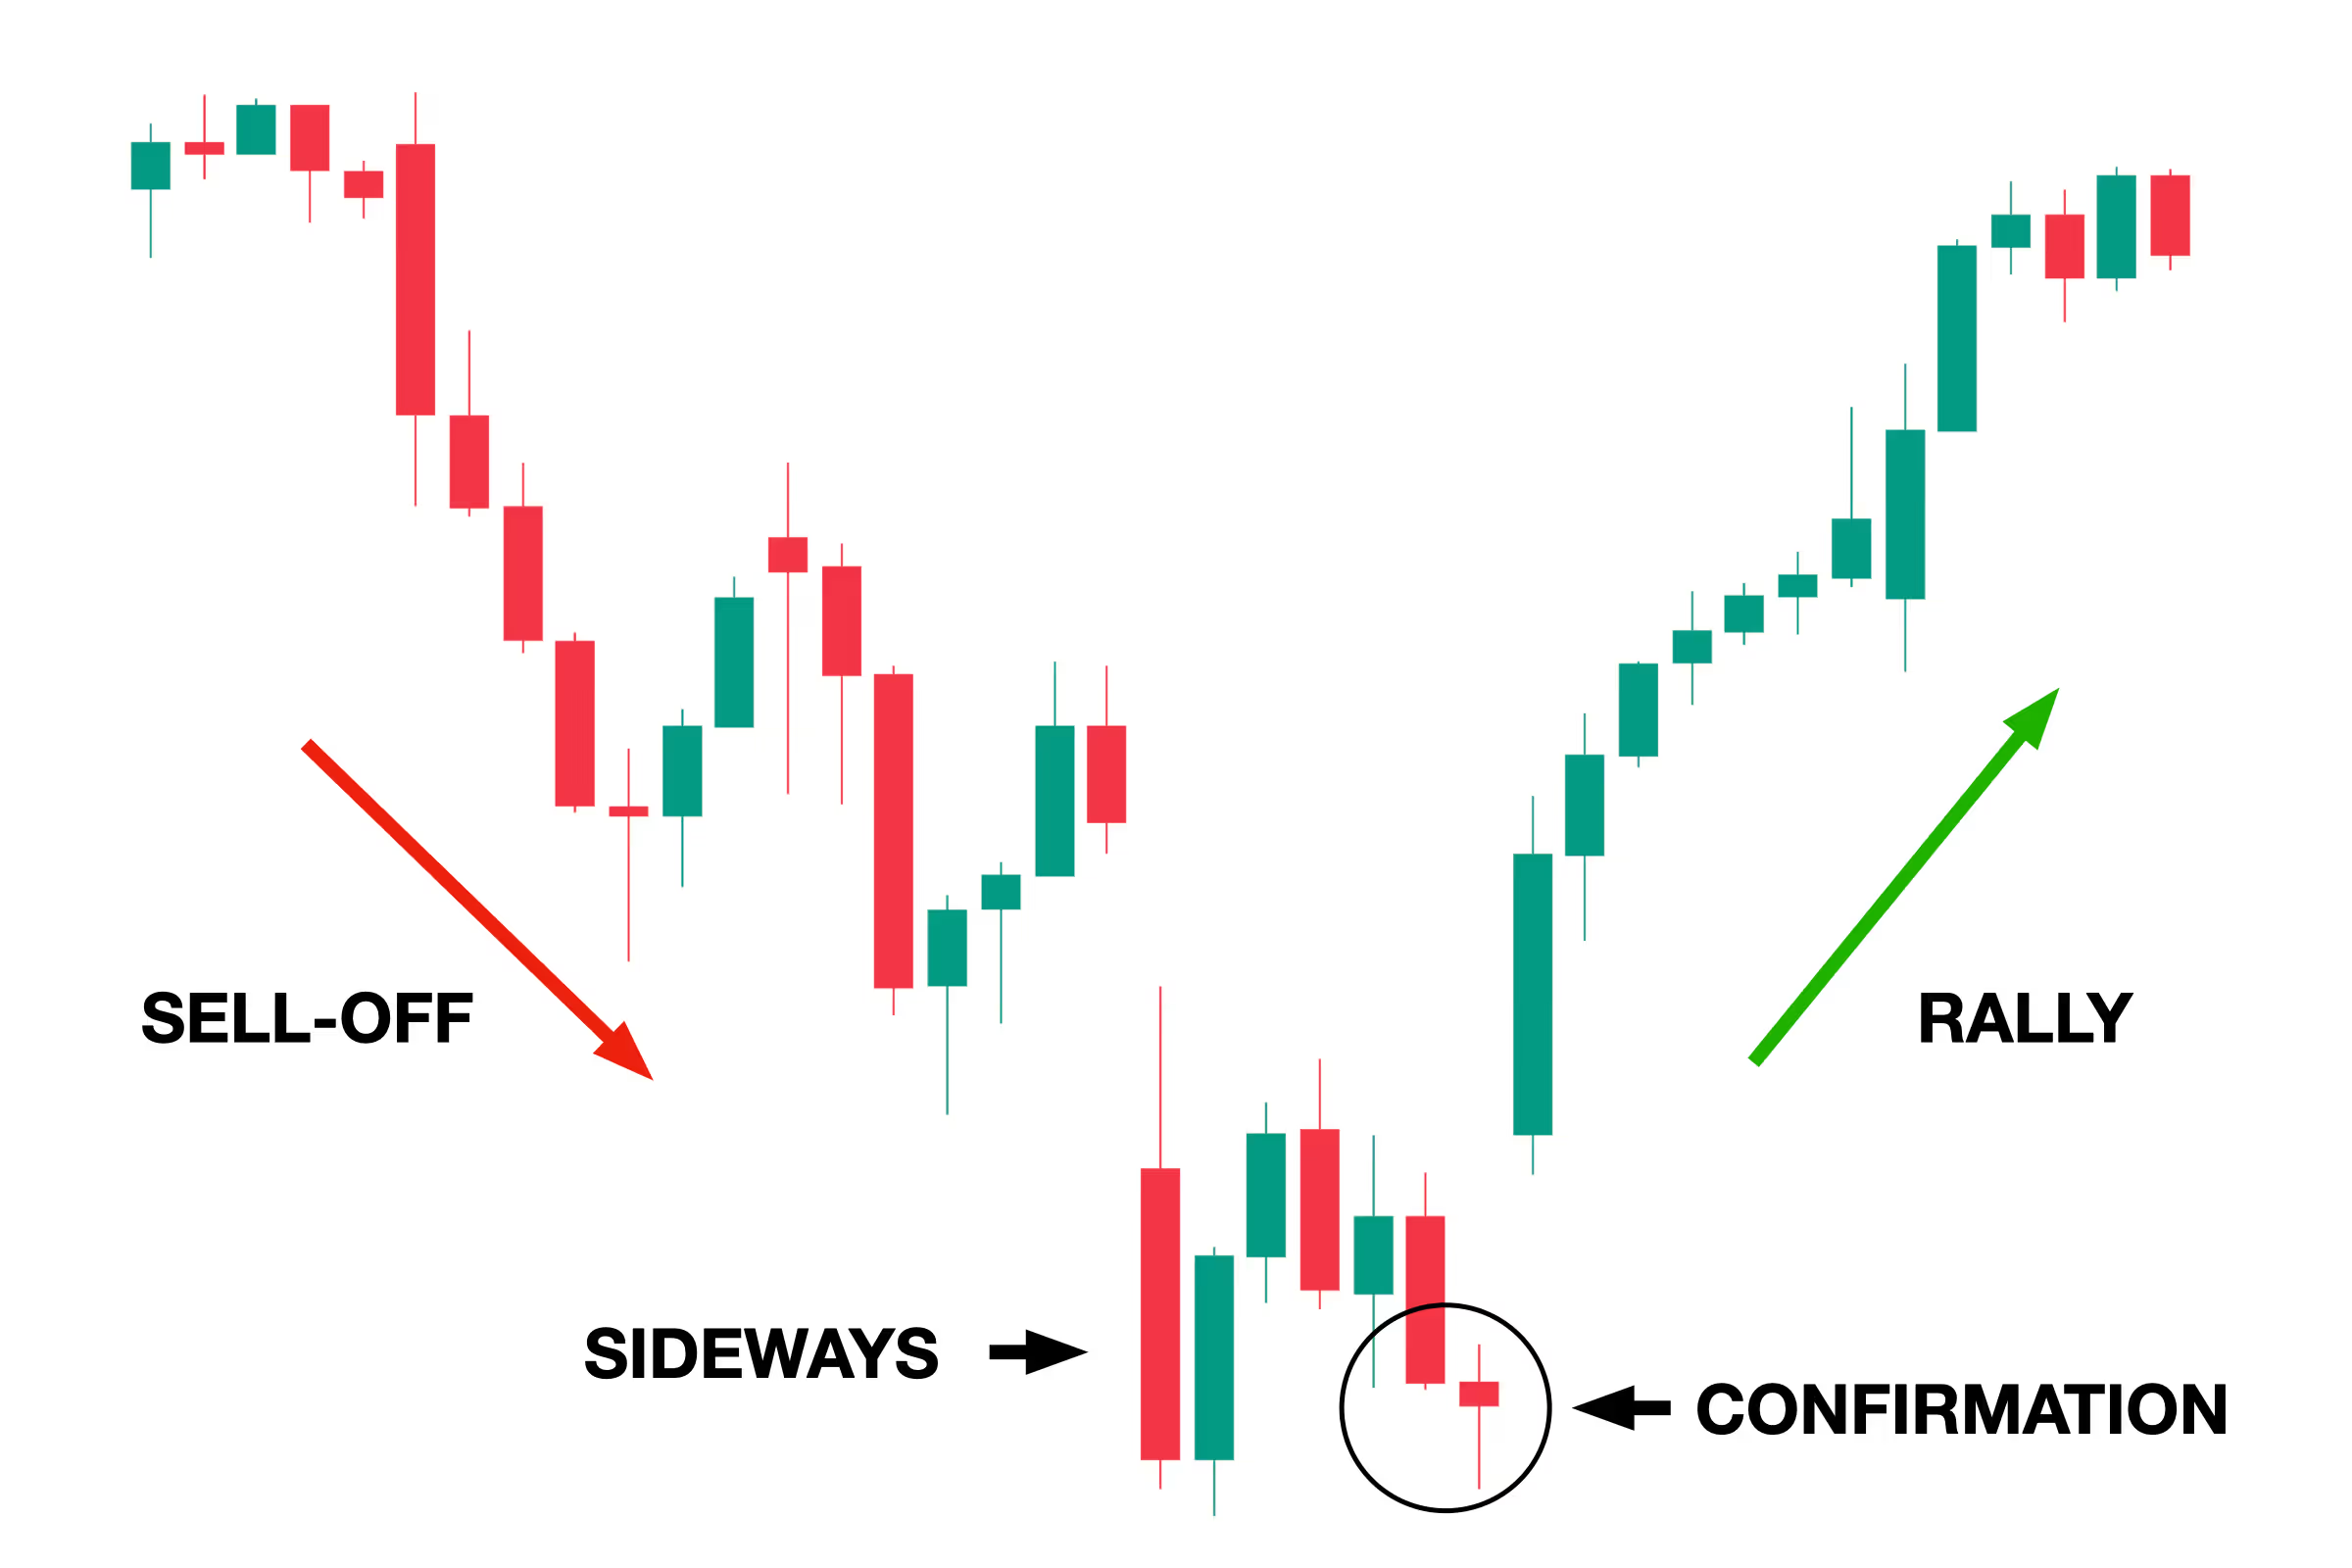
This type of support carries particular weight because it reflects a real shift in market sentiment, from fear to confidence.
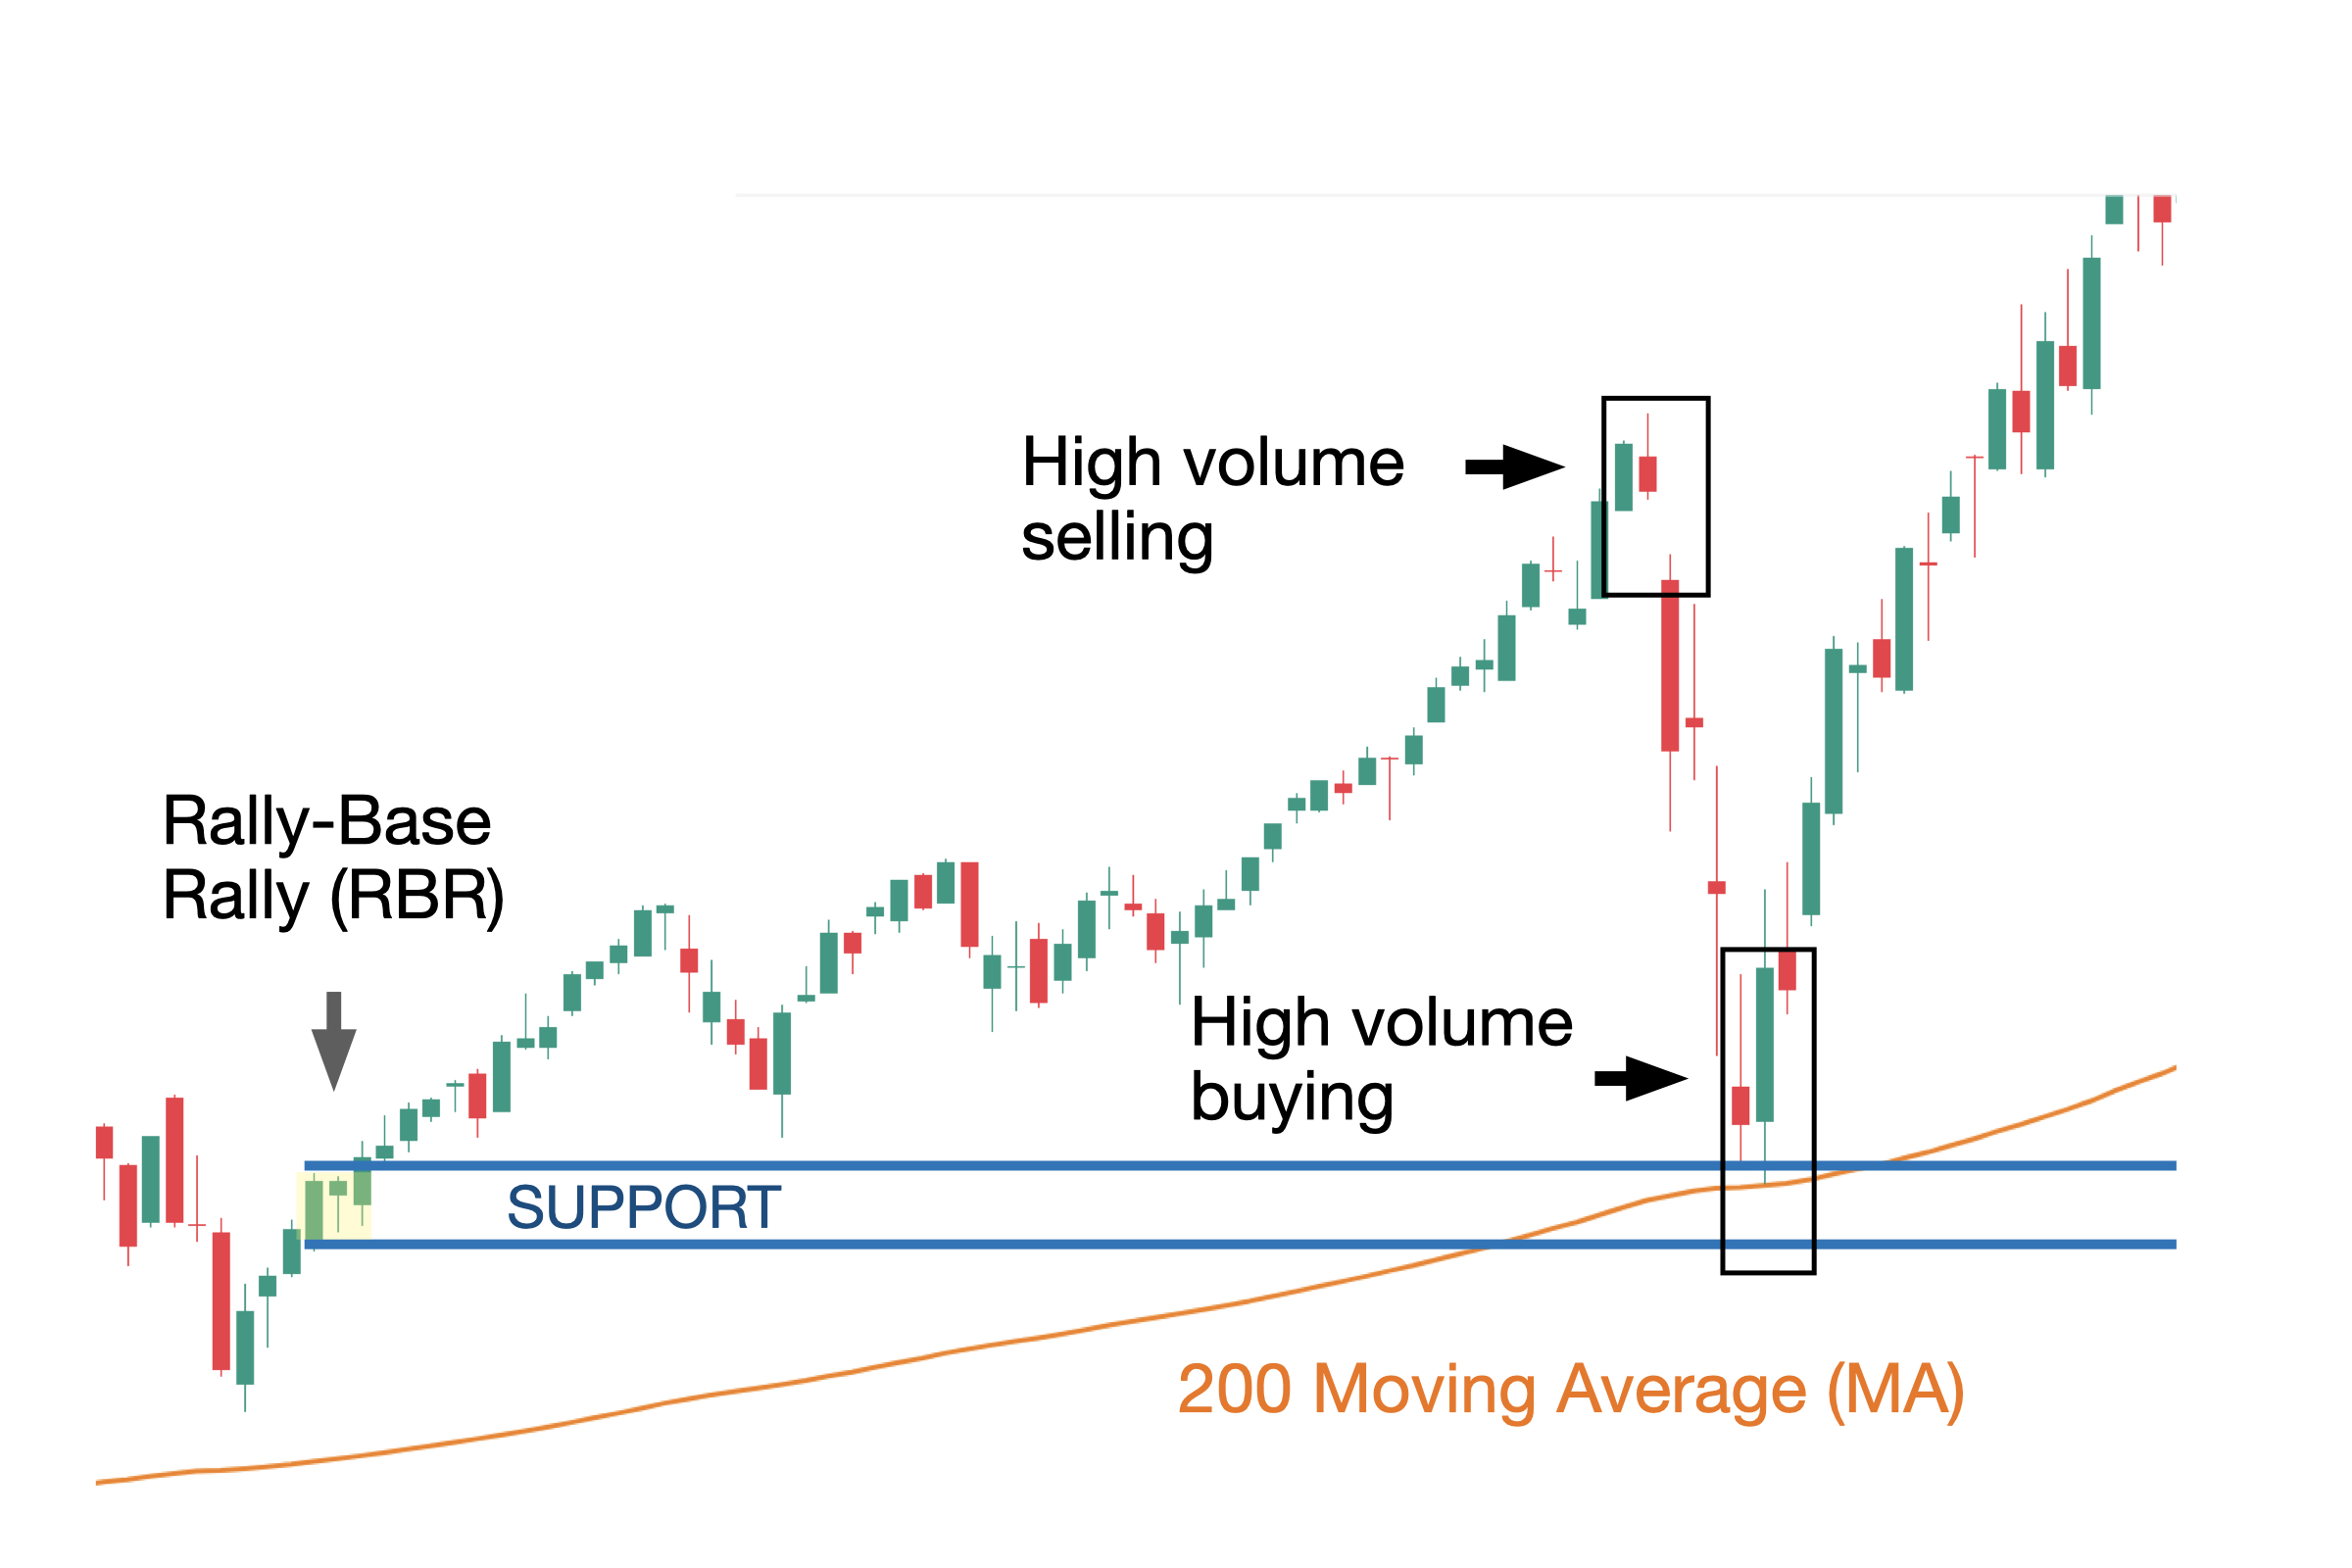
Within an uptrend, support forms in a different, more continuous way. Markets don't move in straight lines — they surge, then pull back, then surge again. Each pullback creates a resting zone where new buyers enter, viewing the dip as a chance to get in at a better price. When buying resumes and the price moves higher, that prior pullback zone becomes support.
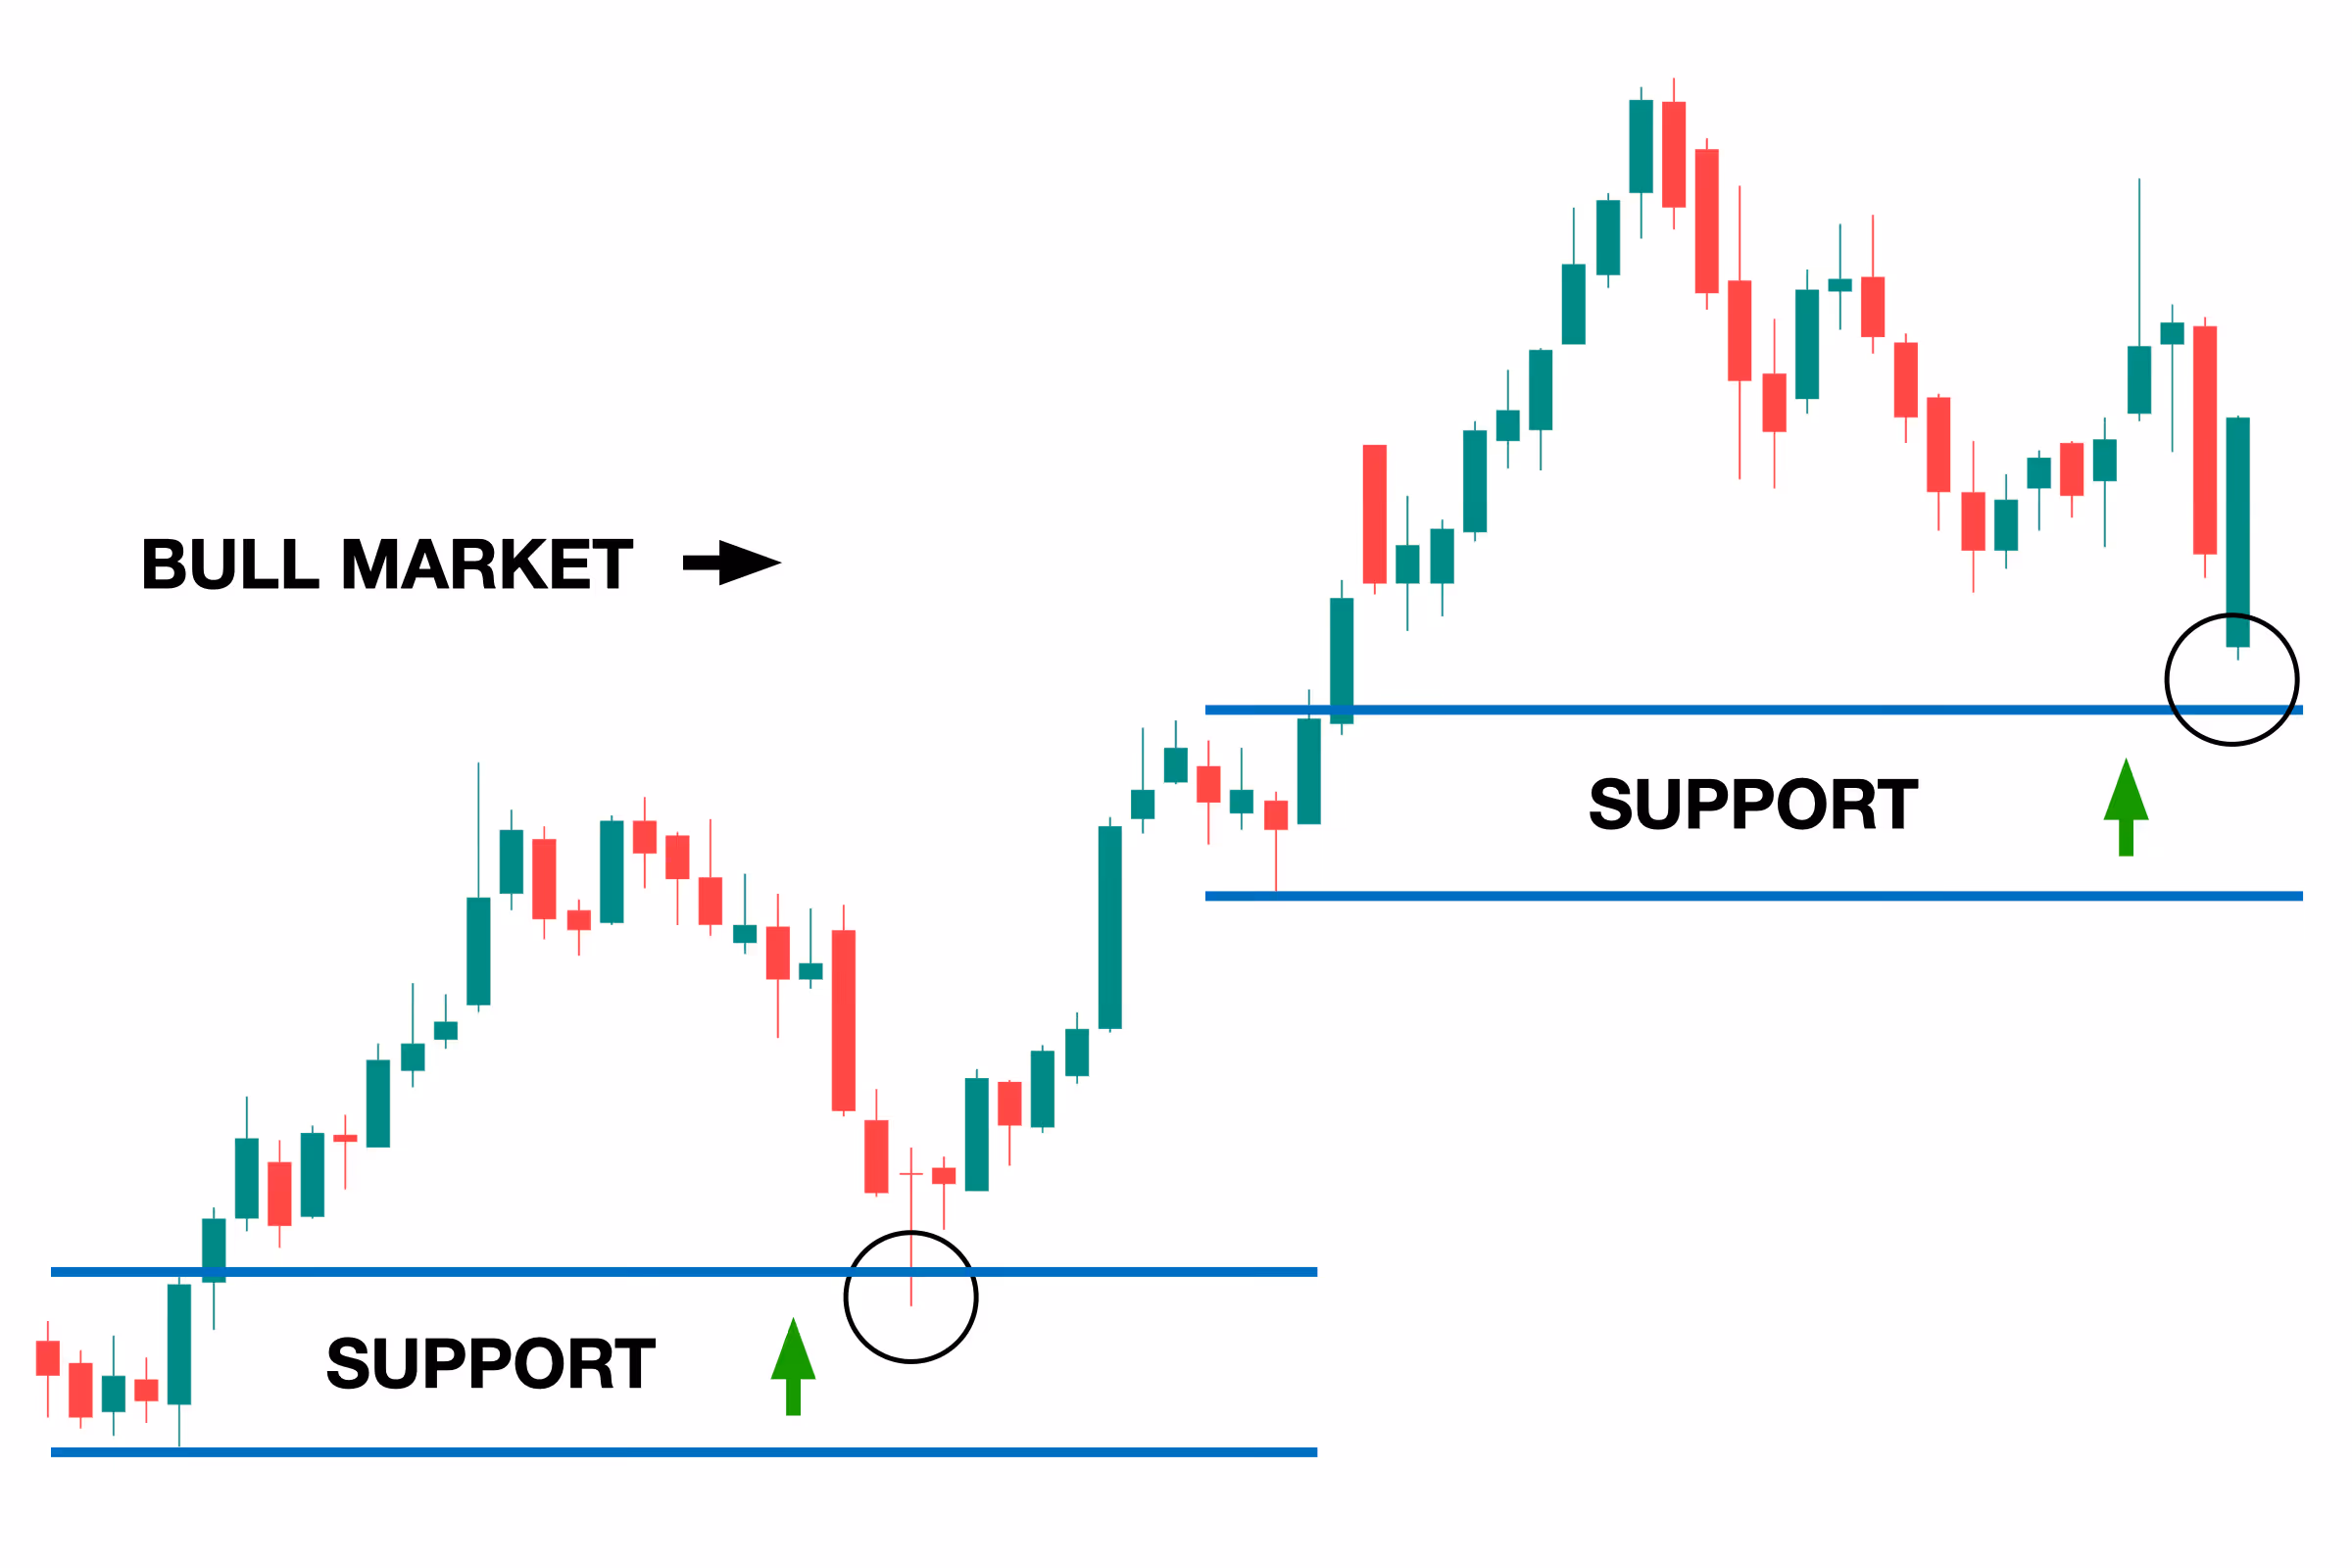
Over time, this creates a staircase structure — a series of higher lows that defines a healthy uptrend.
How Resistance Levels Form
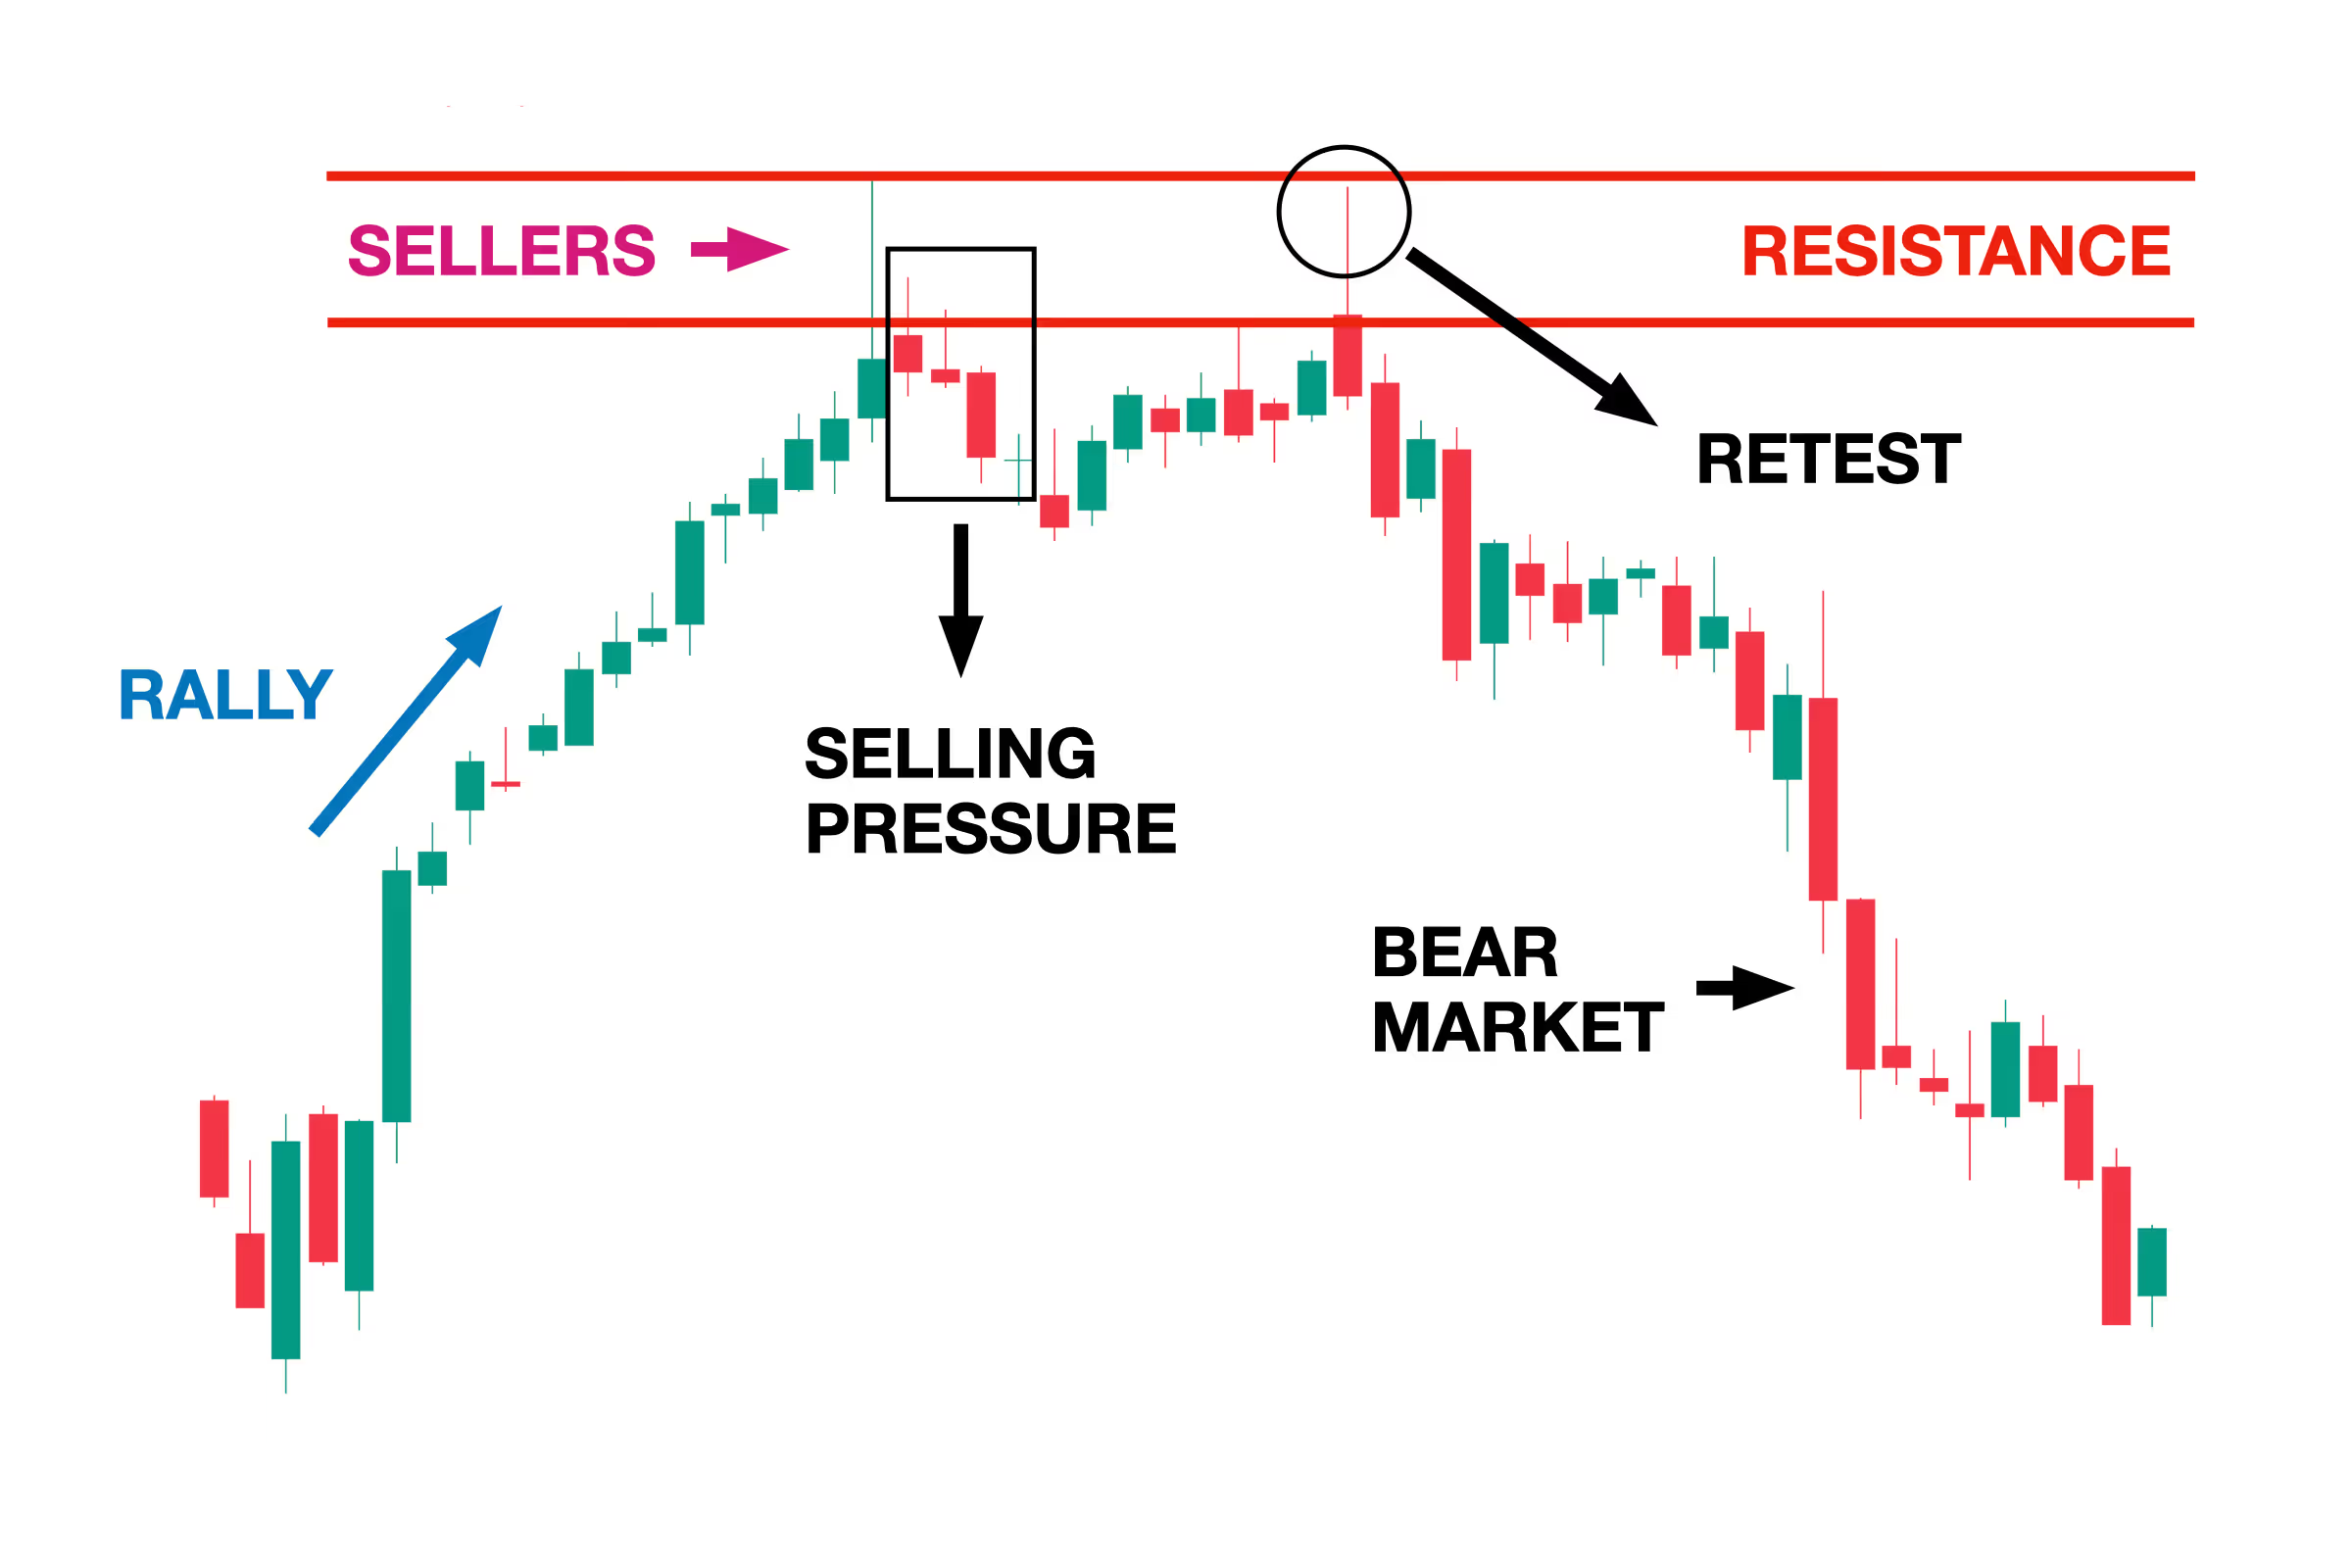
Resistance develops through the opposite process.
After a prolonged rally, early buyers start taking profits. New sellers emerge who believe the price has gone too far. Momentum fades. At some point, price sharply reverses from a level, and sellers take control — that's when the resistance zone is established. A failed retest of that level later on can serve as strong confirmation.
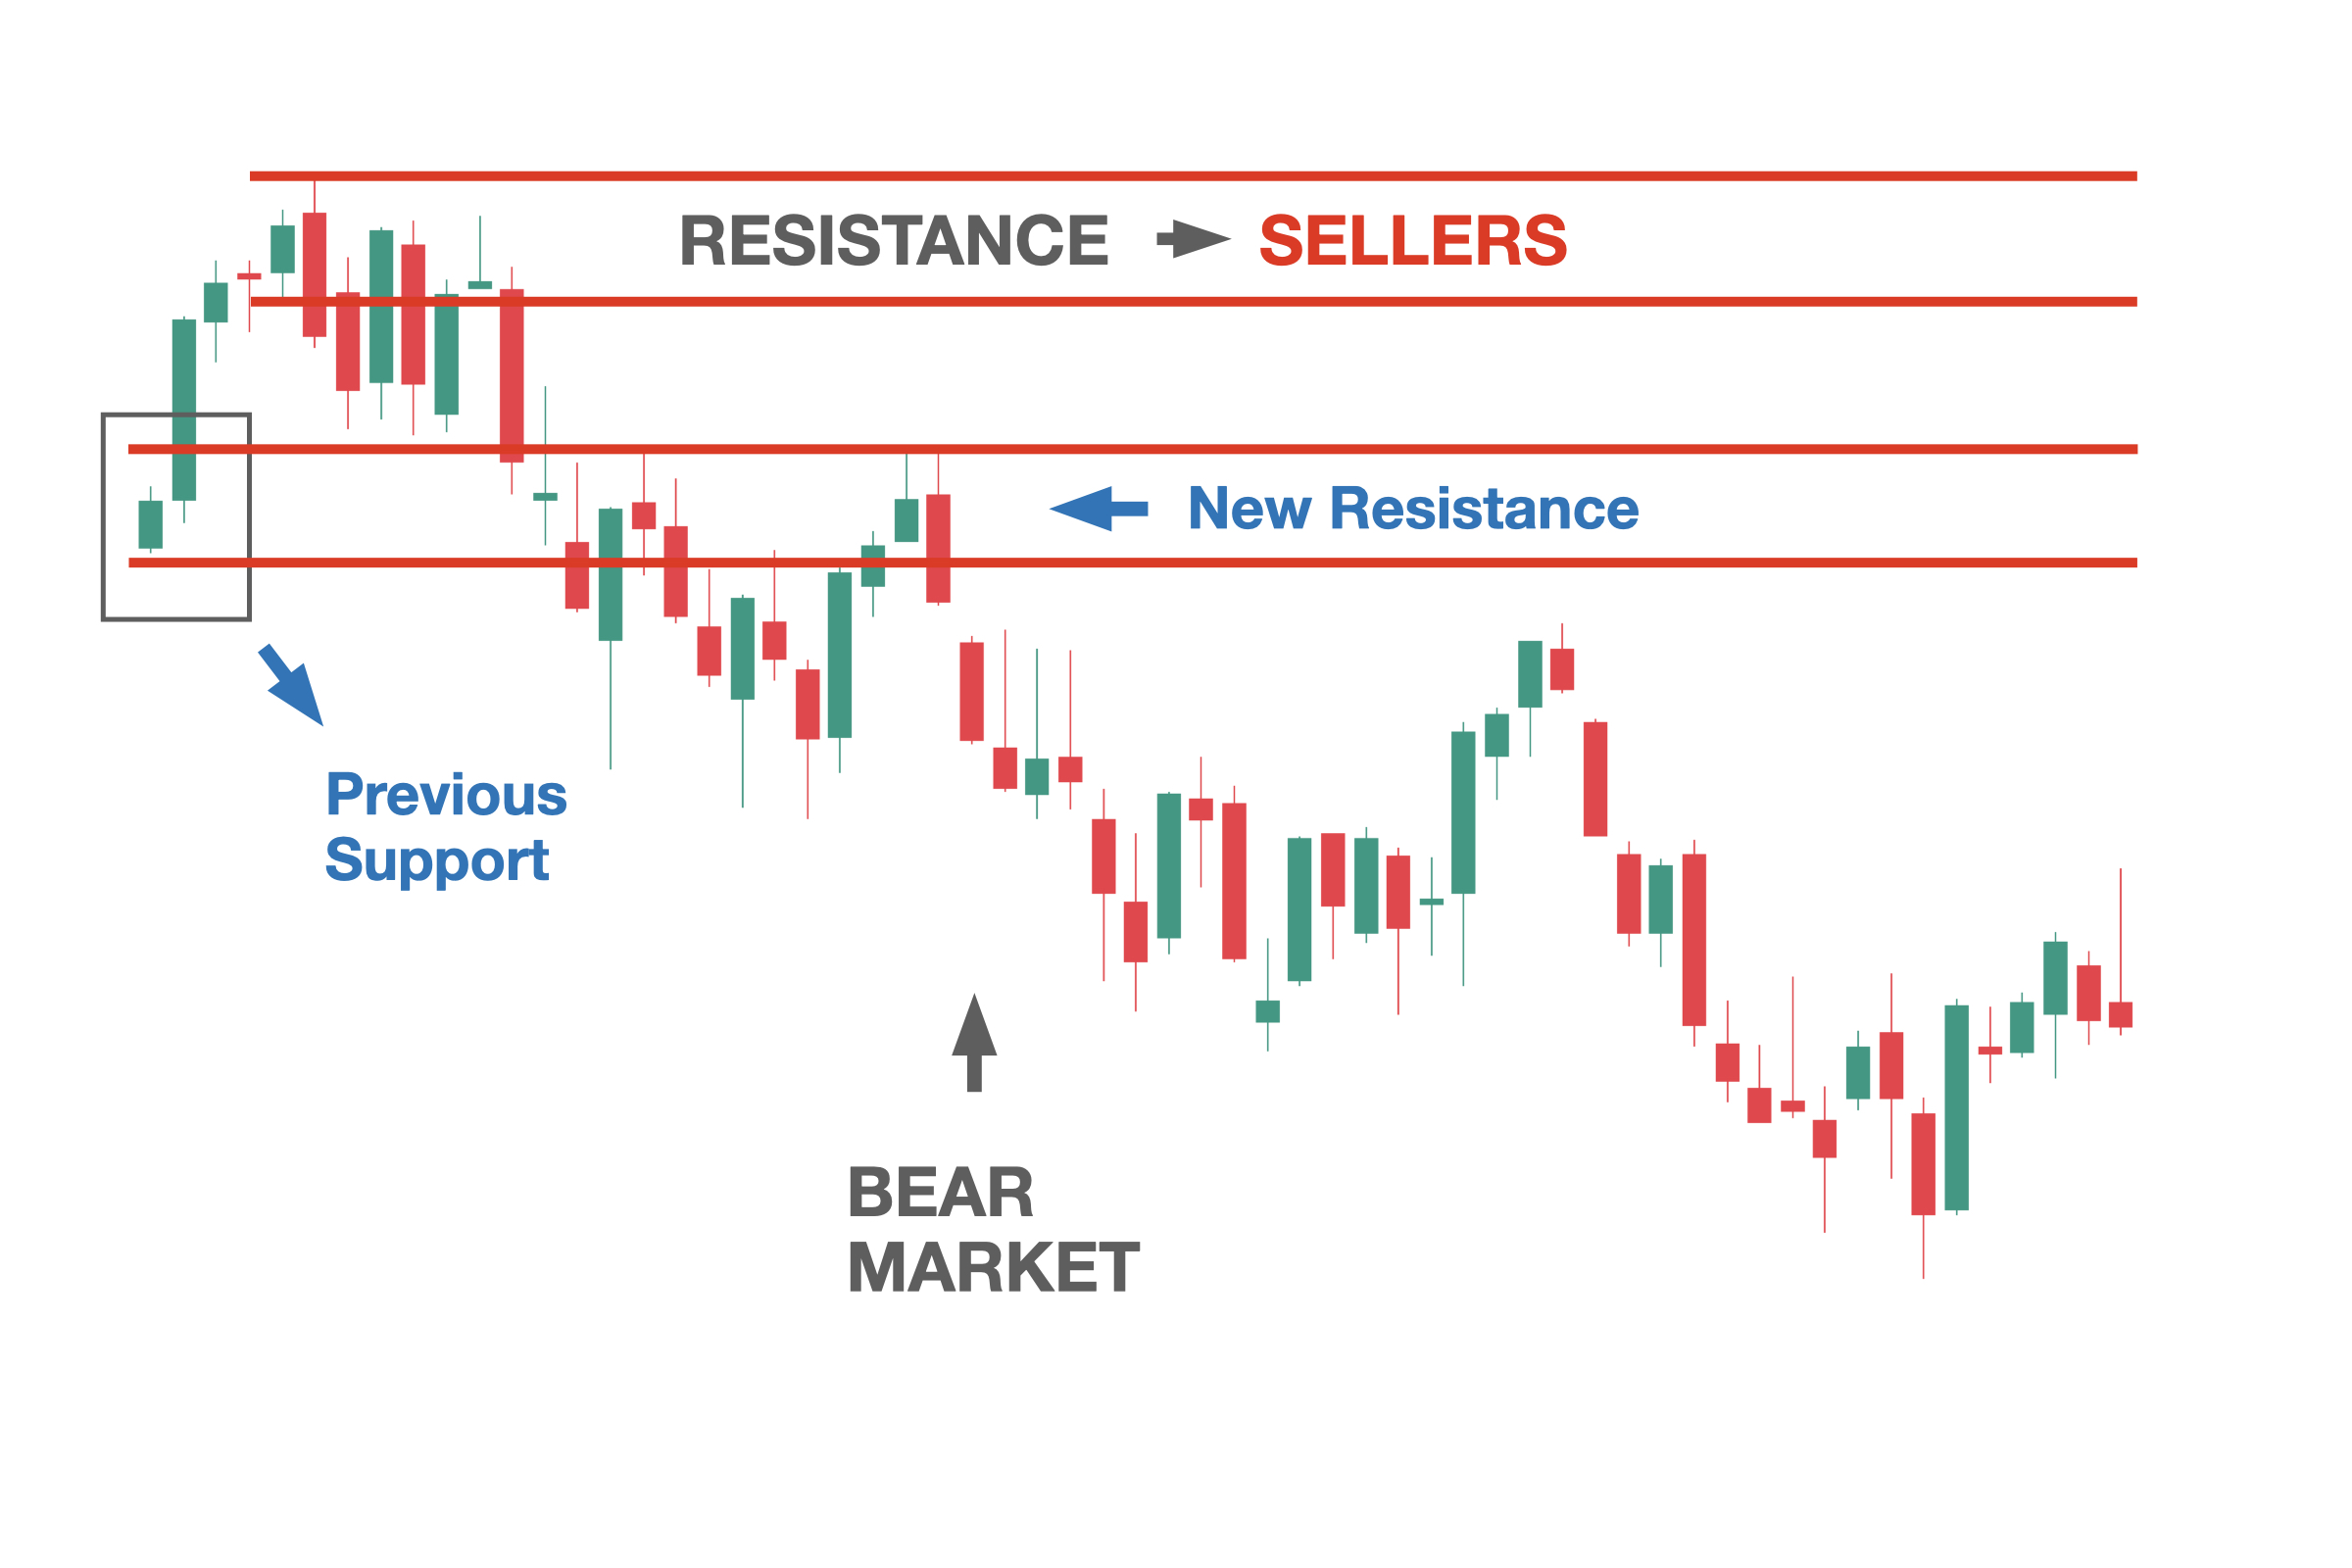
In a downtrend, resistance builds repeatedly as the price moves lower. Broken support levels often flip and become resistance, as traders who bought earlier look to exit at break-even. Short sellers add pressure at these levels, and round numbers tend to act as natural psychological barriers. Together, these factors create zones where price consistently struggles to push higher, reinforcing the downward trend.
What Makes a Level Actually Strong?
Not all support and resistance zones are created equal. The strong ones tend to share a few characteristics.
Multiple touches without breaking is one sign, though with an important nuance. Each time a level is tested, some of the orders defending it get consumed.
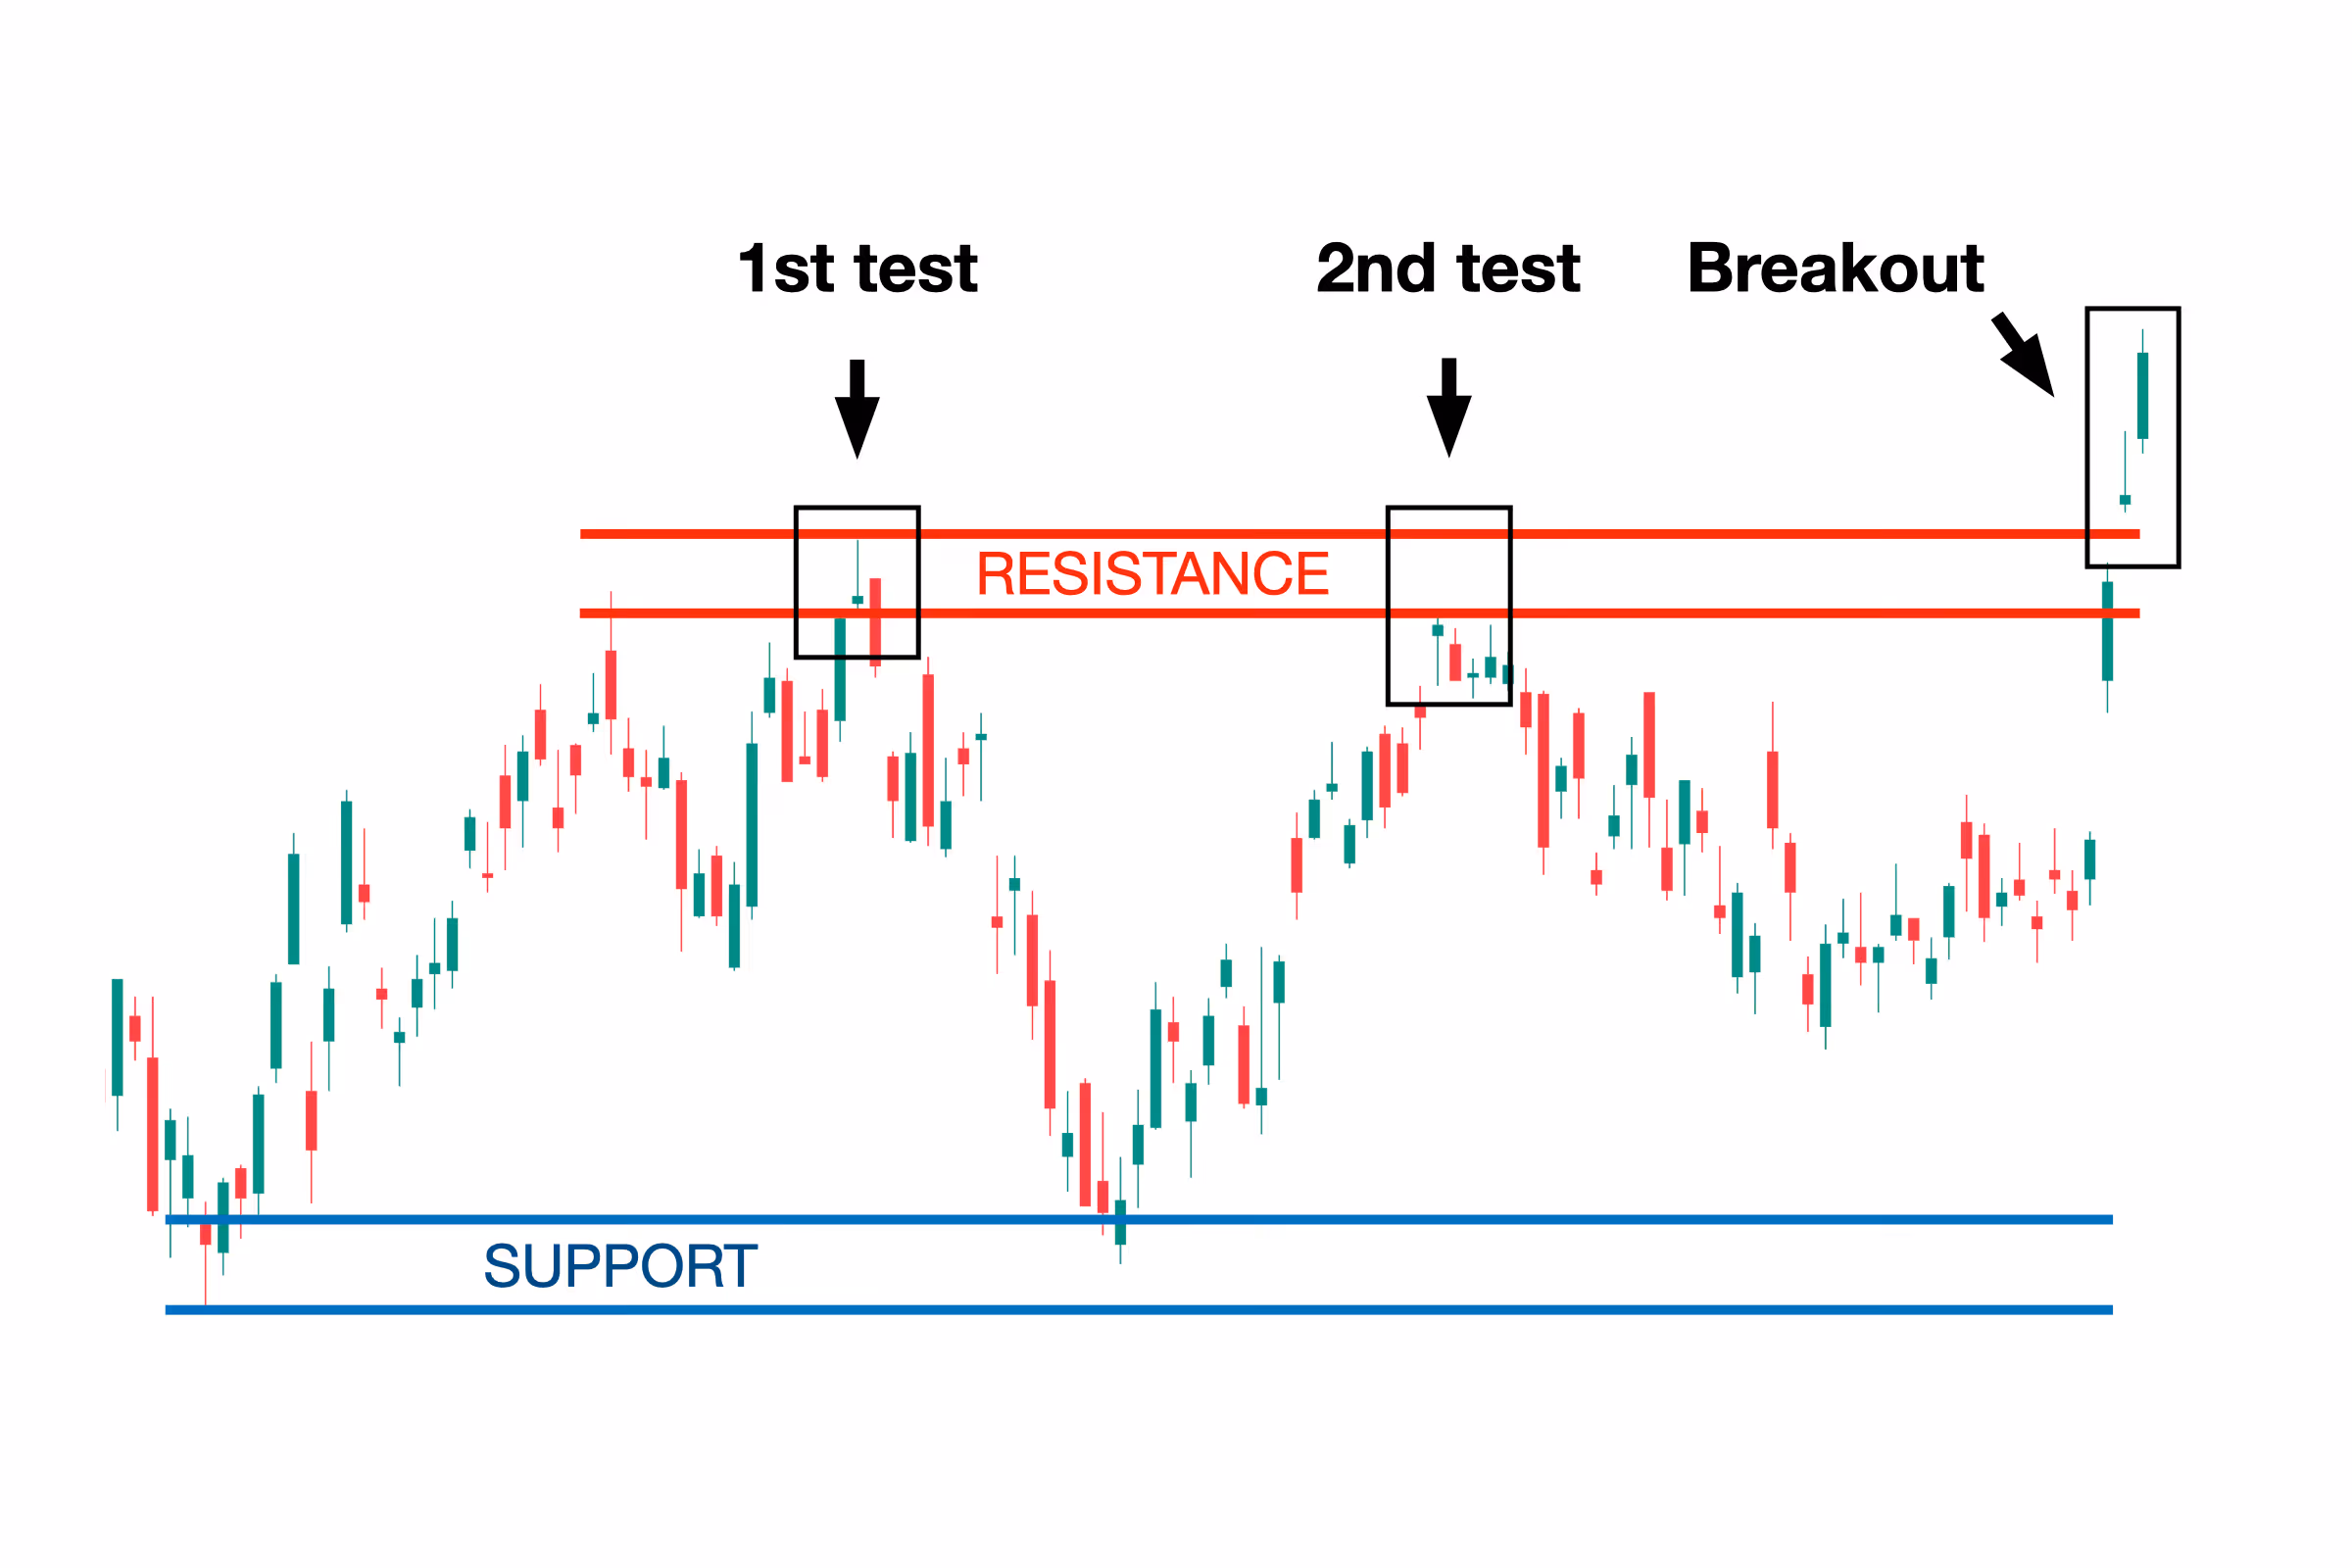
So while more touches can seem like validation, they also gradually erode the level's strength. After two or three tests, there's often less buying power at support or selling pressure at resistance than there was initially, which increases the odds of a breakout.
High trading volume at a level signals real participation — people are actually committed there. Sharp, decisive price reactions (a strong bounce off support, a hard reversal at resistance) indicate active defense of that zone. And when a support or resistance level lines up with other technical factors — a trendline, a moving average, a round number — that confluence adds weight to it.
The bottom line: fresh levels that have only been touched once or twice tend to be stronger than ones tested more than two times. After two or more tests, I'd treat that level with greater skepticism unless the market is clearly ranging sideways, where levels are naturally tested more frequently before eventually breaking.
Common Mistakes to Avoid
Treating levels as exact prices rather than zones.
Price doesn't always stop on a dime. Markets overshoot, especially during volatile or fear-driven moves. If your stop is placed right at the edge of a support level with no room for flexibility, you'll get taken out before the trade can work. Think in terms of zones, not lines, and size your stops accordingly.
Ignoring the broader market context.
Support in a strong uptrend behaves differently from support in a downtrend. In trending markets, counter-trend levels break far more often than they hold. In a ranging market, support and resistance become much more reliable and can be traded repeatedly. Failing to read the environment first is one of the quickest ways to lose money on otherwise reasonable-looking setups.
Jumping in too early.
The desire to catch the exact top or bottom is almost universal among newer traders — and it's almost universally expensive. In strong trends, many apparent reversal zones fail one after another before a real turn finally occurs. Each failed attempt chips away at your confidence and your account. By the time the actual reversal arrives, you might feel too beaten down to take it. Waiting for clear confirmation before entering isn't the most exciting approach, but it's far more reliable.
Trading every level you can find.
More is not better here. Selective is better. As a level gets tested repeatedly, the orders that were holding it thin out. The more frequently traders pile into the same zones, the faster those zones wear out. Focus on fresh, high-quality levels rather than trying to trade every potential reaction point on the chart.
Putting It Into Practice
Support and resistance zones serve as the backbone of many practical trading decisions: where to enter, where to place stops, where to take profits, and how to assess whether a trend is intact. I'll go deeper into each of those applications in future articles.
At a basic level, a trader might look to buy near a support zone with a stop placed just below it — risking a defined amount in exchange for a shot at a larger move toward resistance. The reverse applies for selling near resistance. What ties it all together is the concept of risk-to-reward: if a potential trade risks $1 to make $1, it's rarely worth it. But if the same setup risks $1 to make $3 or $4, the math starts working in your favor over time, even if you're not right every single trade.
That's the real power of trading with support and resistance. It gives you a structured way to define your risk before you enter and to evaluate whether a setup is actually worth taking.
Conclusion
Support and resistance are, at their core, a reflection of human behavior at scale. They're where fear, greed, memory, and decision-making all converge into visible patterns on a chart. Learning to identify these zones, understanding why they form, and knowing how to trade around them effectively can genuinely transform the way you approach markets.
Think back to the shopper looking for the best deal. That instinct — buying value, avoiding overpaying — is exactly what support and resistance help you do in trading. There's a reason traders often say that profits aren't made when you sell, but when you buy. Getting your entry right, in the right place, at the right time, is where the real edge lives.
Topics
Trading Myths

Beginner Trading

Technical Analysis
Market Education

Risk Management