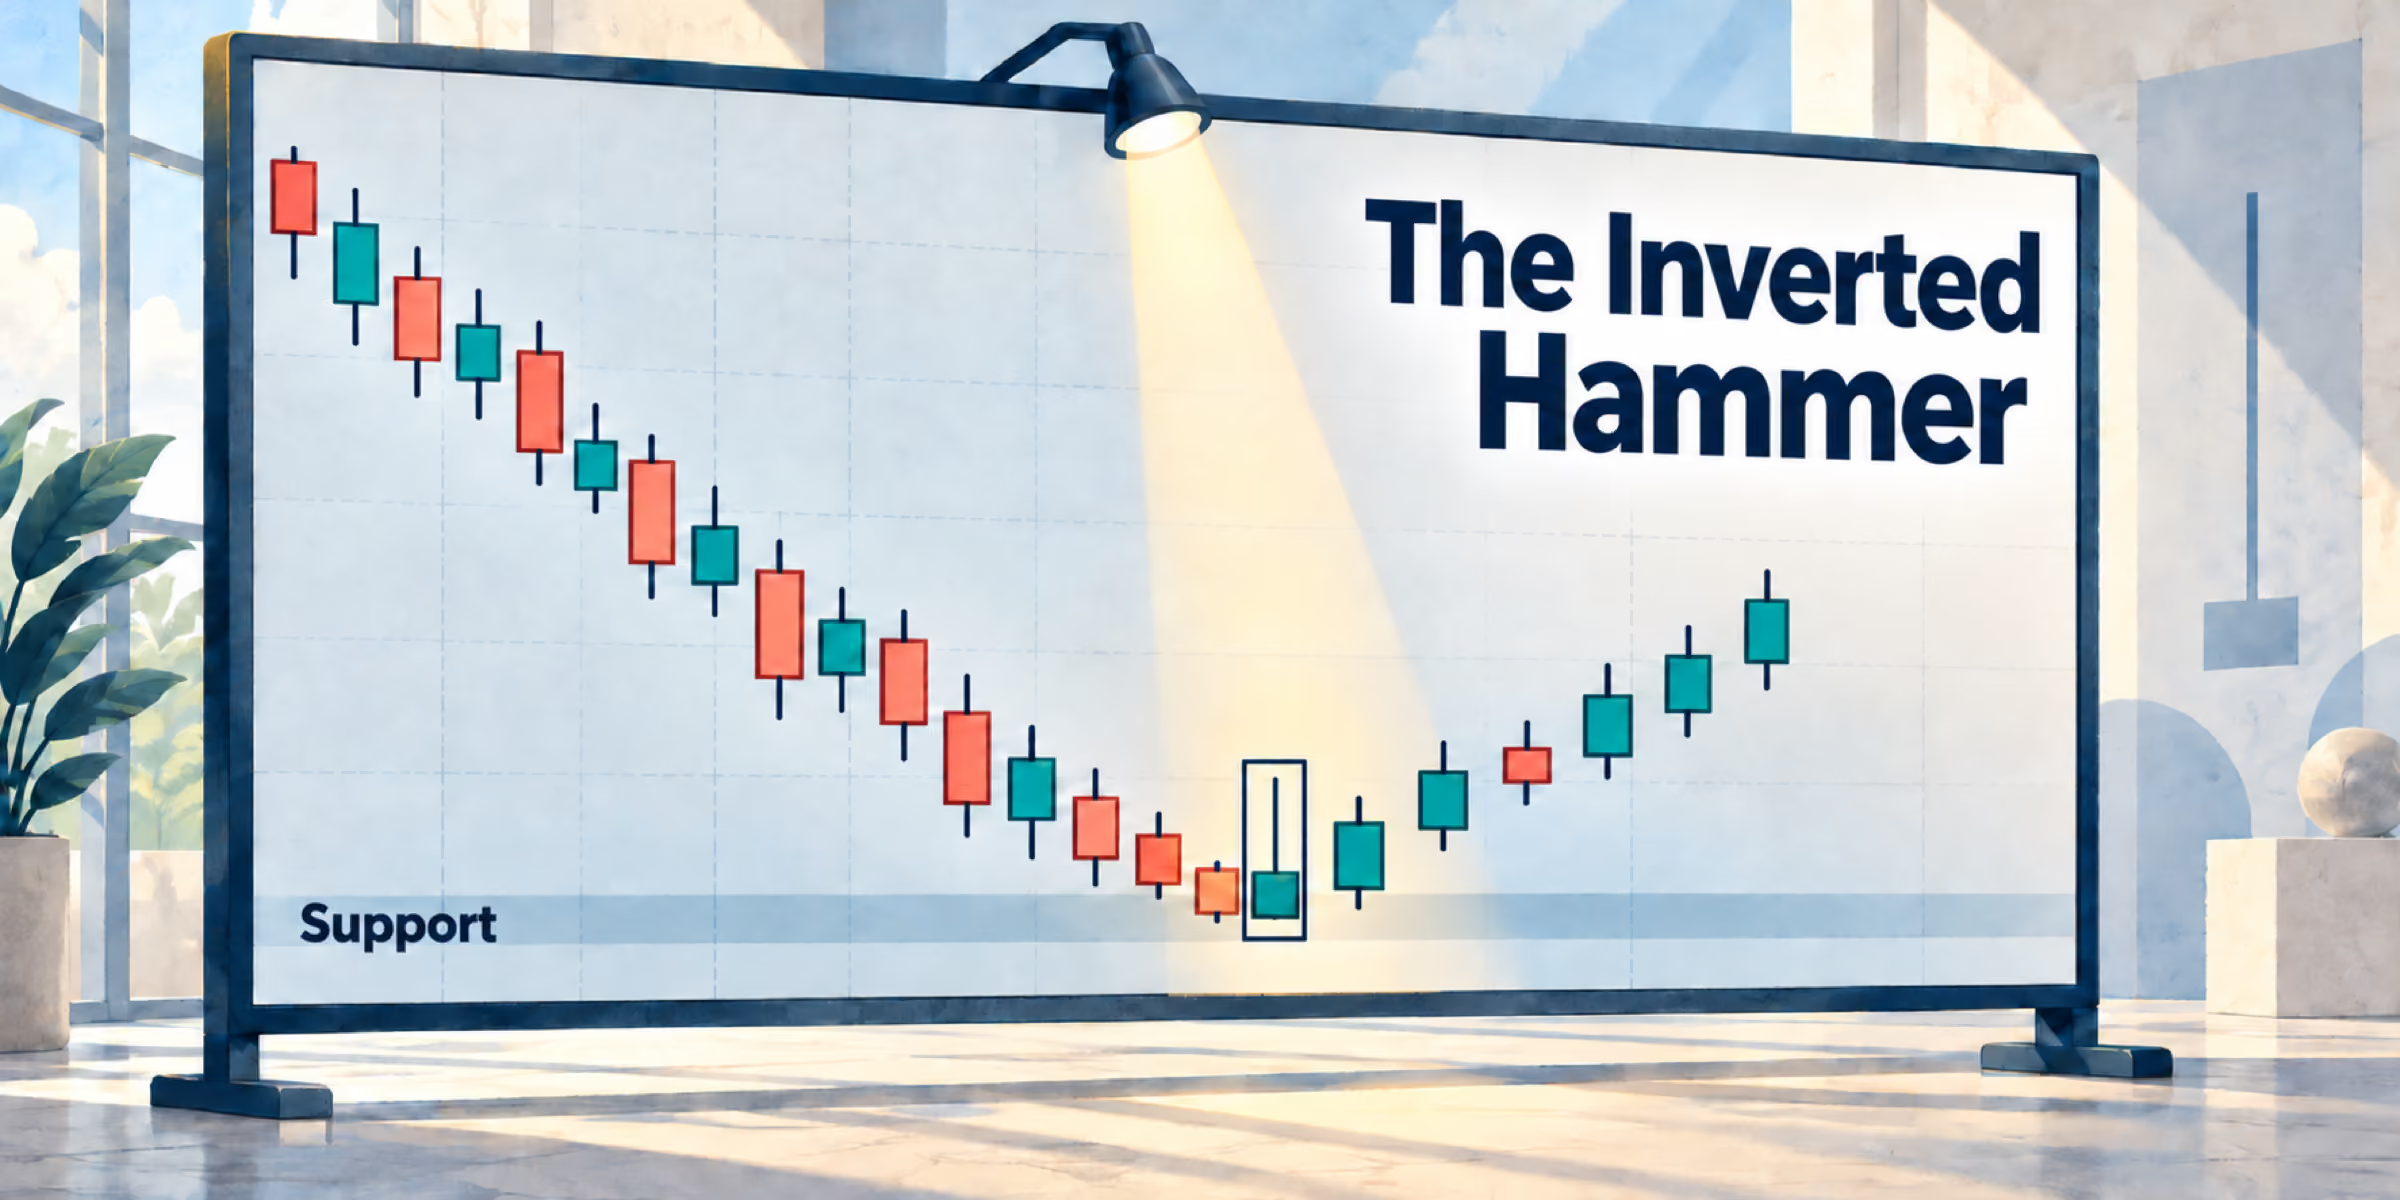
The Hammer Candlestick: Spot Reversals Before They Happen


The Hammer Candlestick: One Pattern That Can Change How You Read the Market
There's a moment every trader knows well. You're staring at a chart, the price has been falling for days, and somewhere in the back of your mind, you're asking the same question: Is this the bottom, or does it have further to fall?
Getting that answer wrong costs money. Getting it right — consistently — is what separates professional traders from amateurs. And while no single tool will ever give you a perfect signal, some patterns come remarkably close to telling you when the tide is about to turn.
One of them is the hammer candlestick. It's not a complicated pattern. It's a single-candle pattern that looks exactly like its name suggests, and once you know what to look for, you'll start spotting it everywhere. More importantly, you'll understand what it's actually telling you about the battle taking place between buyers and sellers — because that's really what every candlestick is: a snapshot of a war.
Let's break it all down.
What Is the Hammer, Exactly?
The hammer is one of the most recognizable bullish candlestick patterns in technical analysis. It gets its name for the obvious reason — the candle itself looks like a hammer. A small body sitting near the top, and a long lower wick stretching down like a handle. Clean, simple, and easy to recognize.
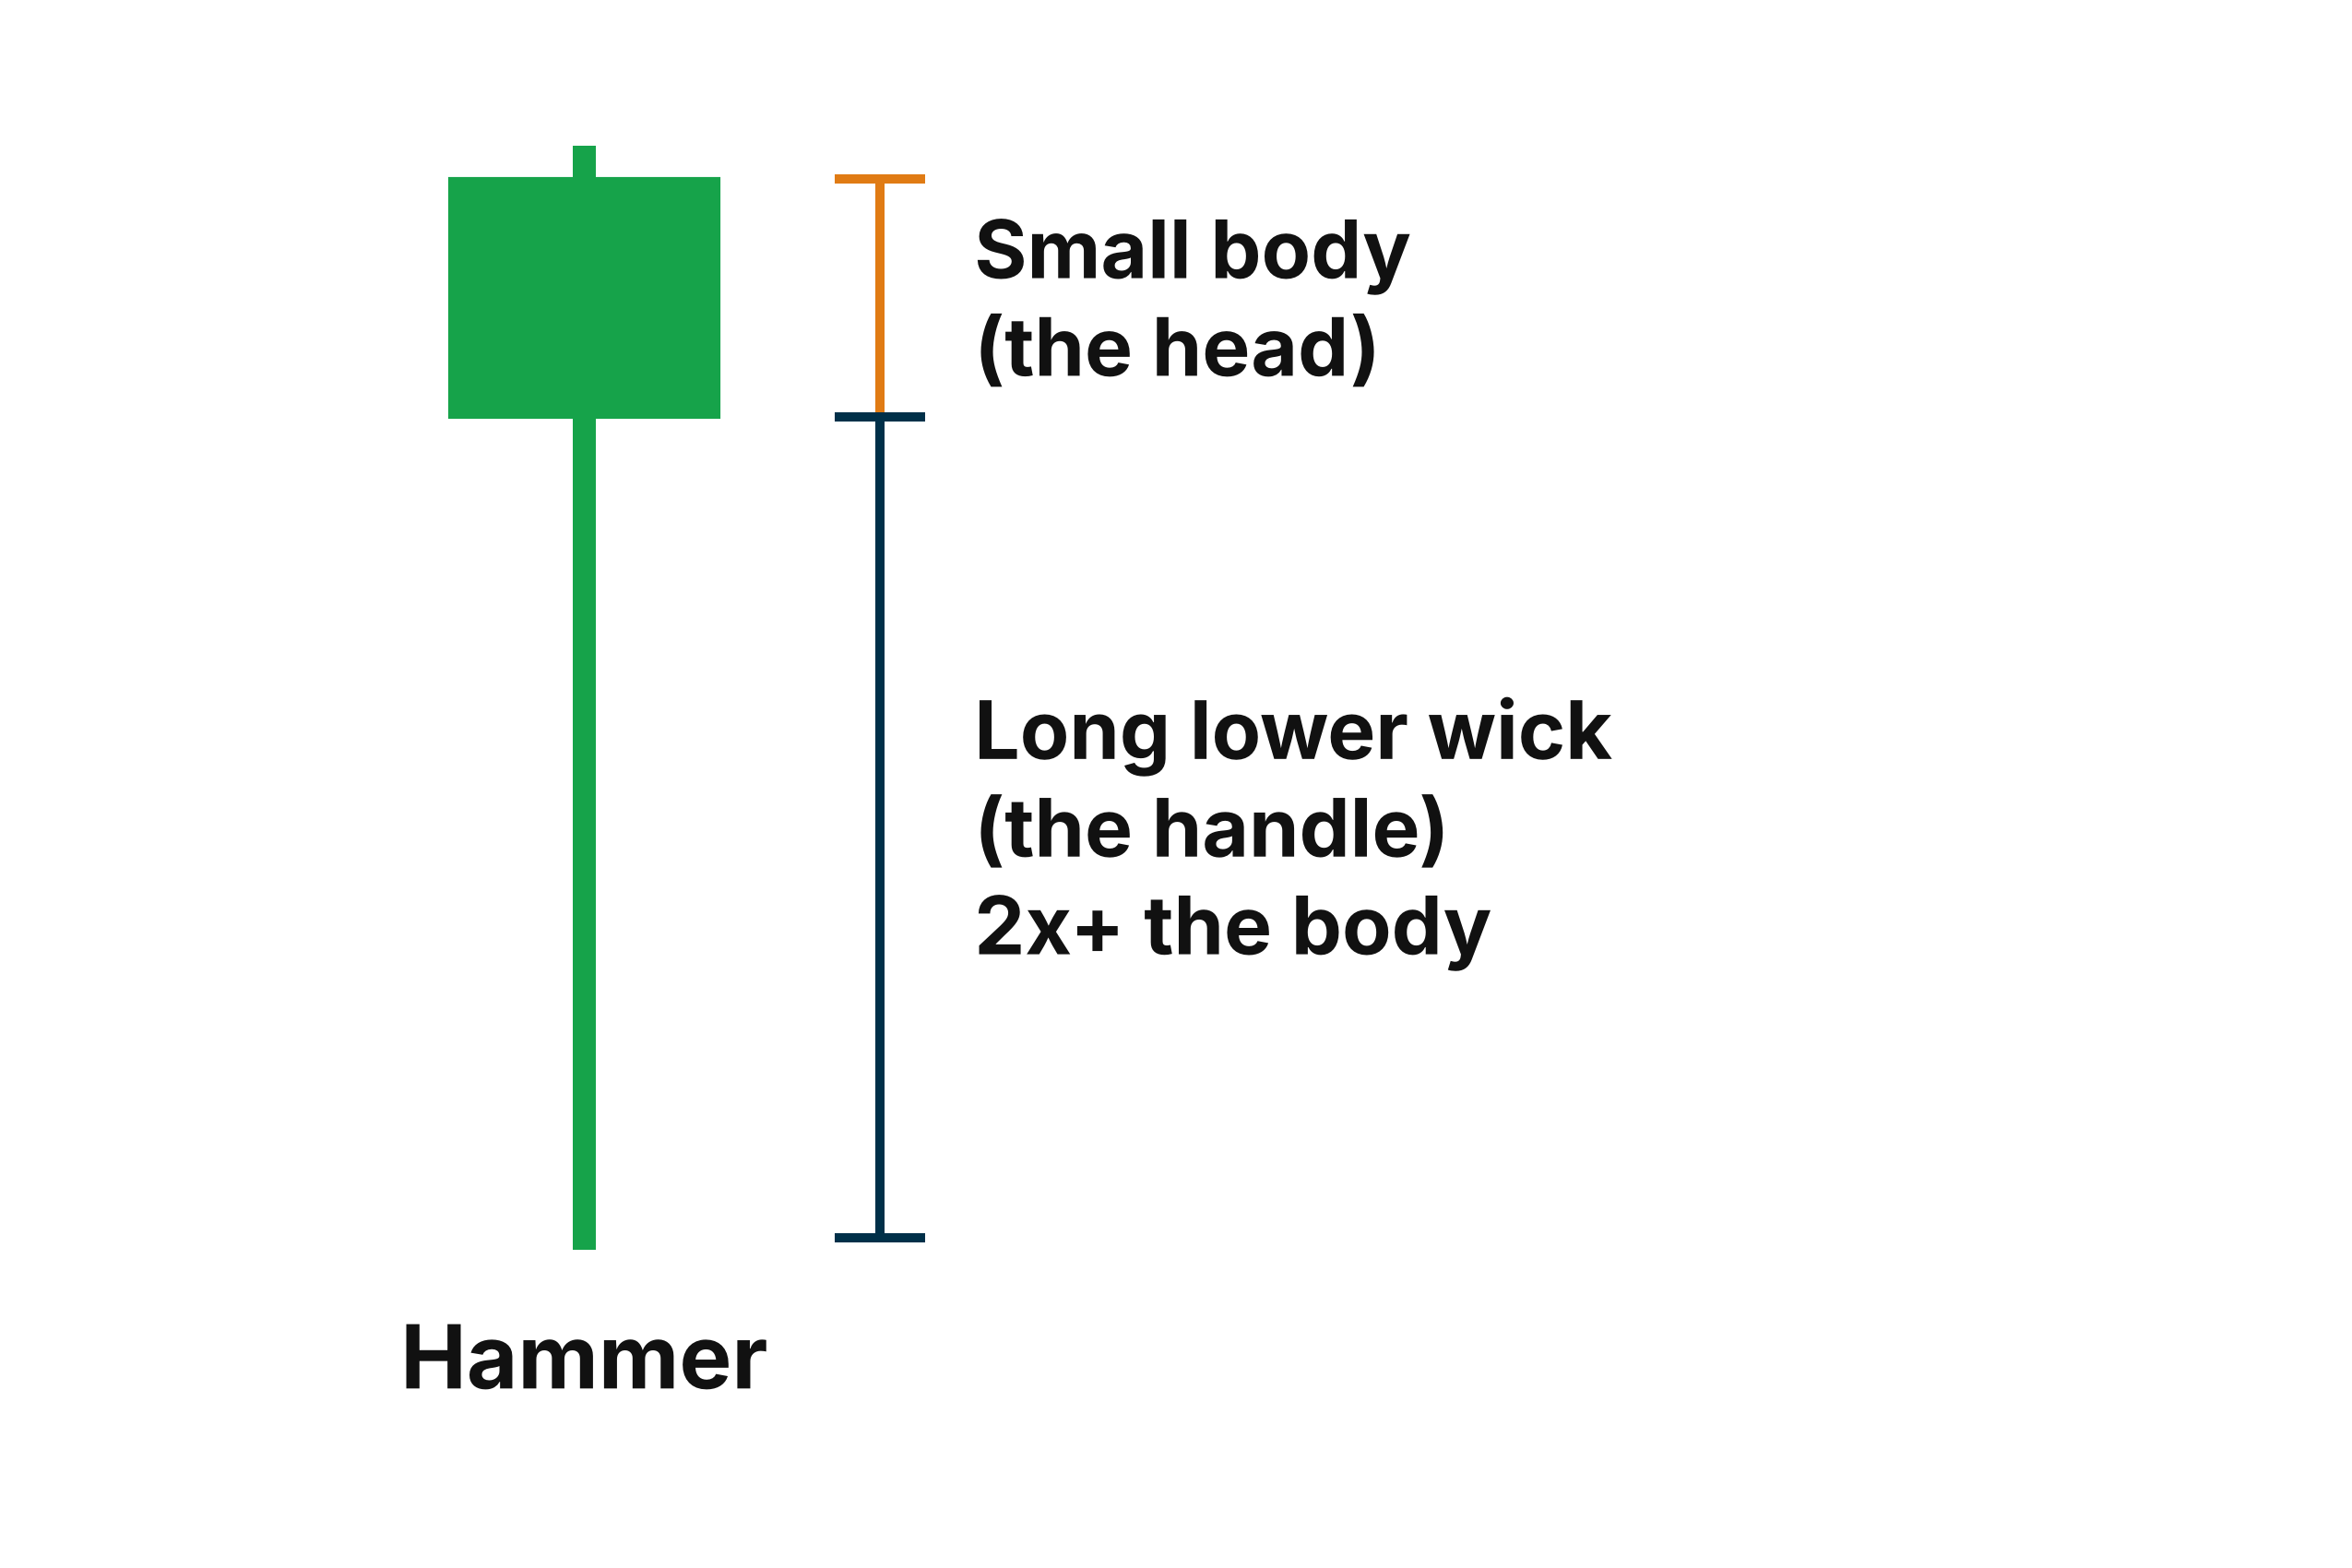
It's a single-candle pattern, which already sets it apart from more complex formations that require two, three, or even five candles to confirm. The hammer delivers its message in one session. One open, one close, and a long tail that tells a story of rejection.
While the hammer can appear on any time frame — from a 1-minute chart all the way up to a monthly — the daily chart is the easiest place to study it. The signals tend to be more reliable, the price moves are more meaningful, and the structure is simpler to visualize without the noise that comes with shorter intervals.
Why Location Is Everything
Here's where a lot of traders go wrong, and it's worth spending some real time on this point.
Hammer candles don't appear only at turning points. They appear everywhere. You can pull up any chart, scroll back through months of price action, and find hammer-shaped candles scattered all over the place — in the middle of uptrends, in the middle of nowhere, during sideways chop, and so on. The shape alone means nothing without context.
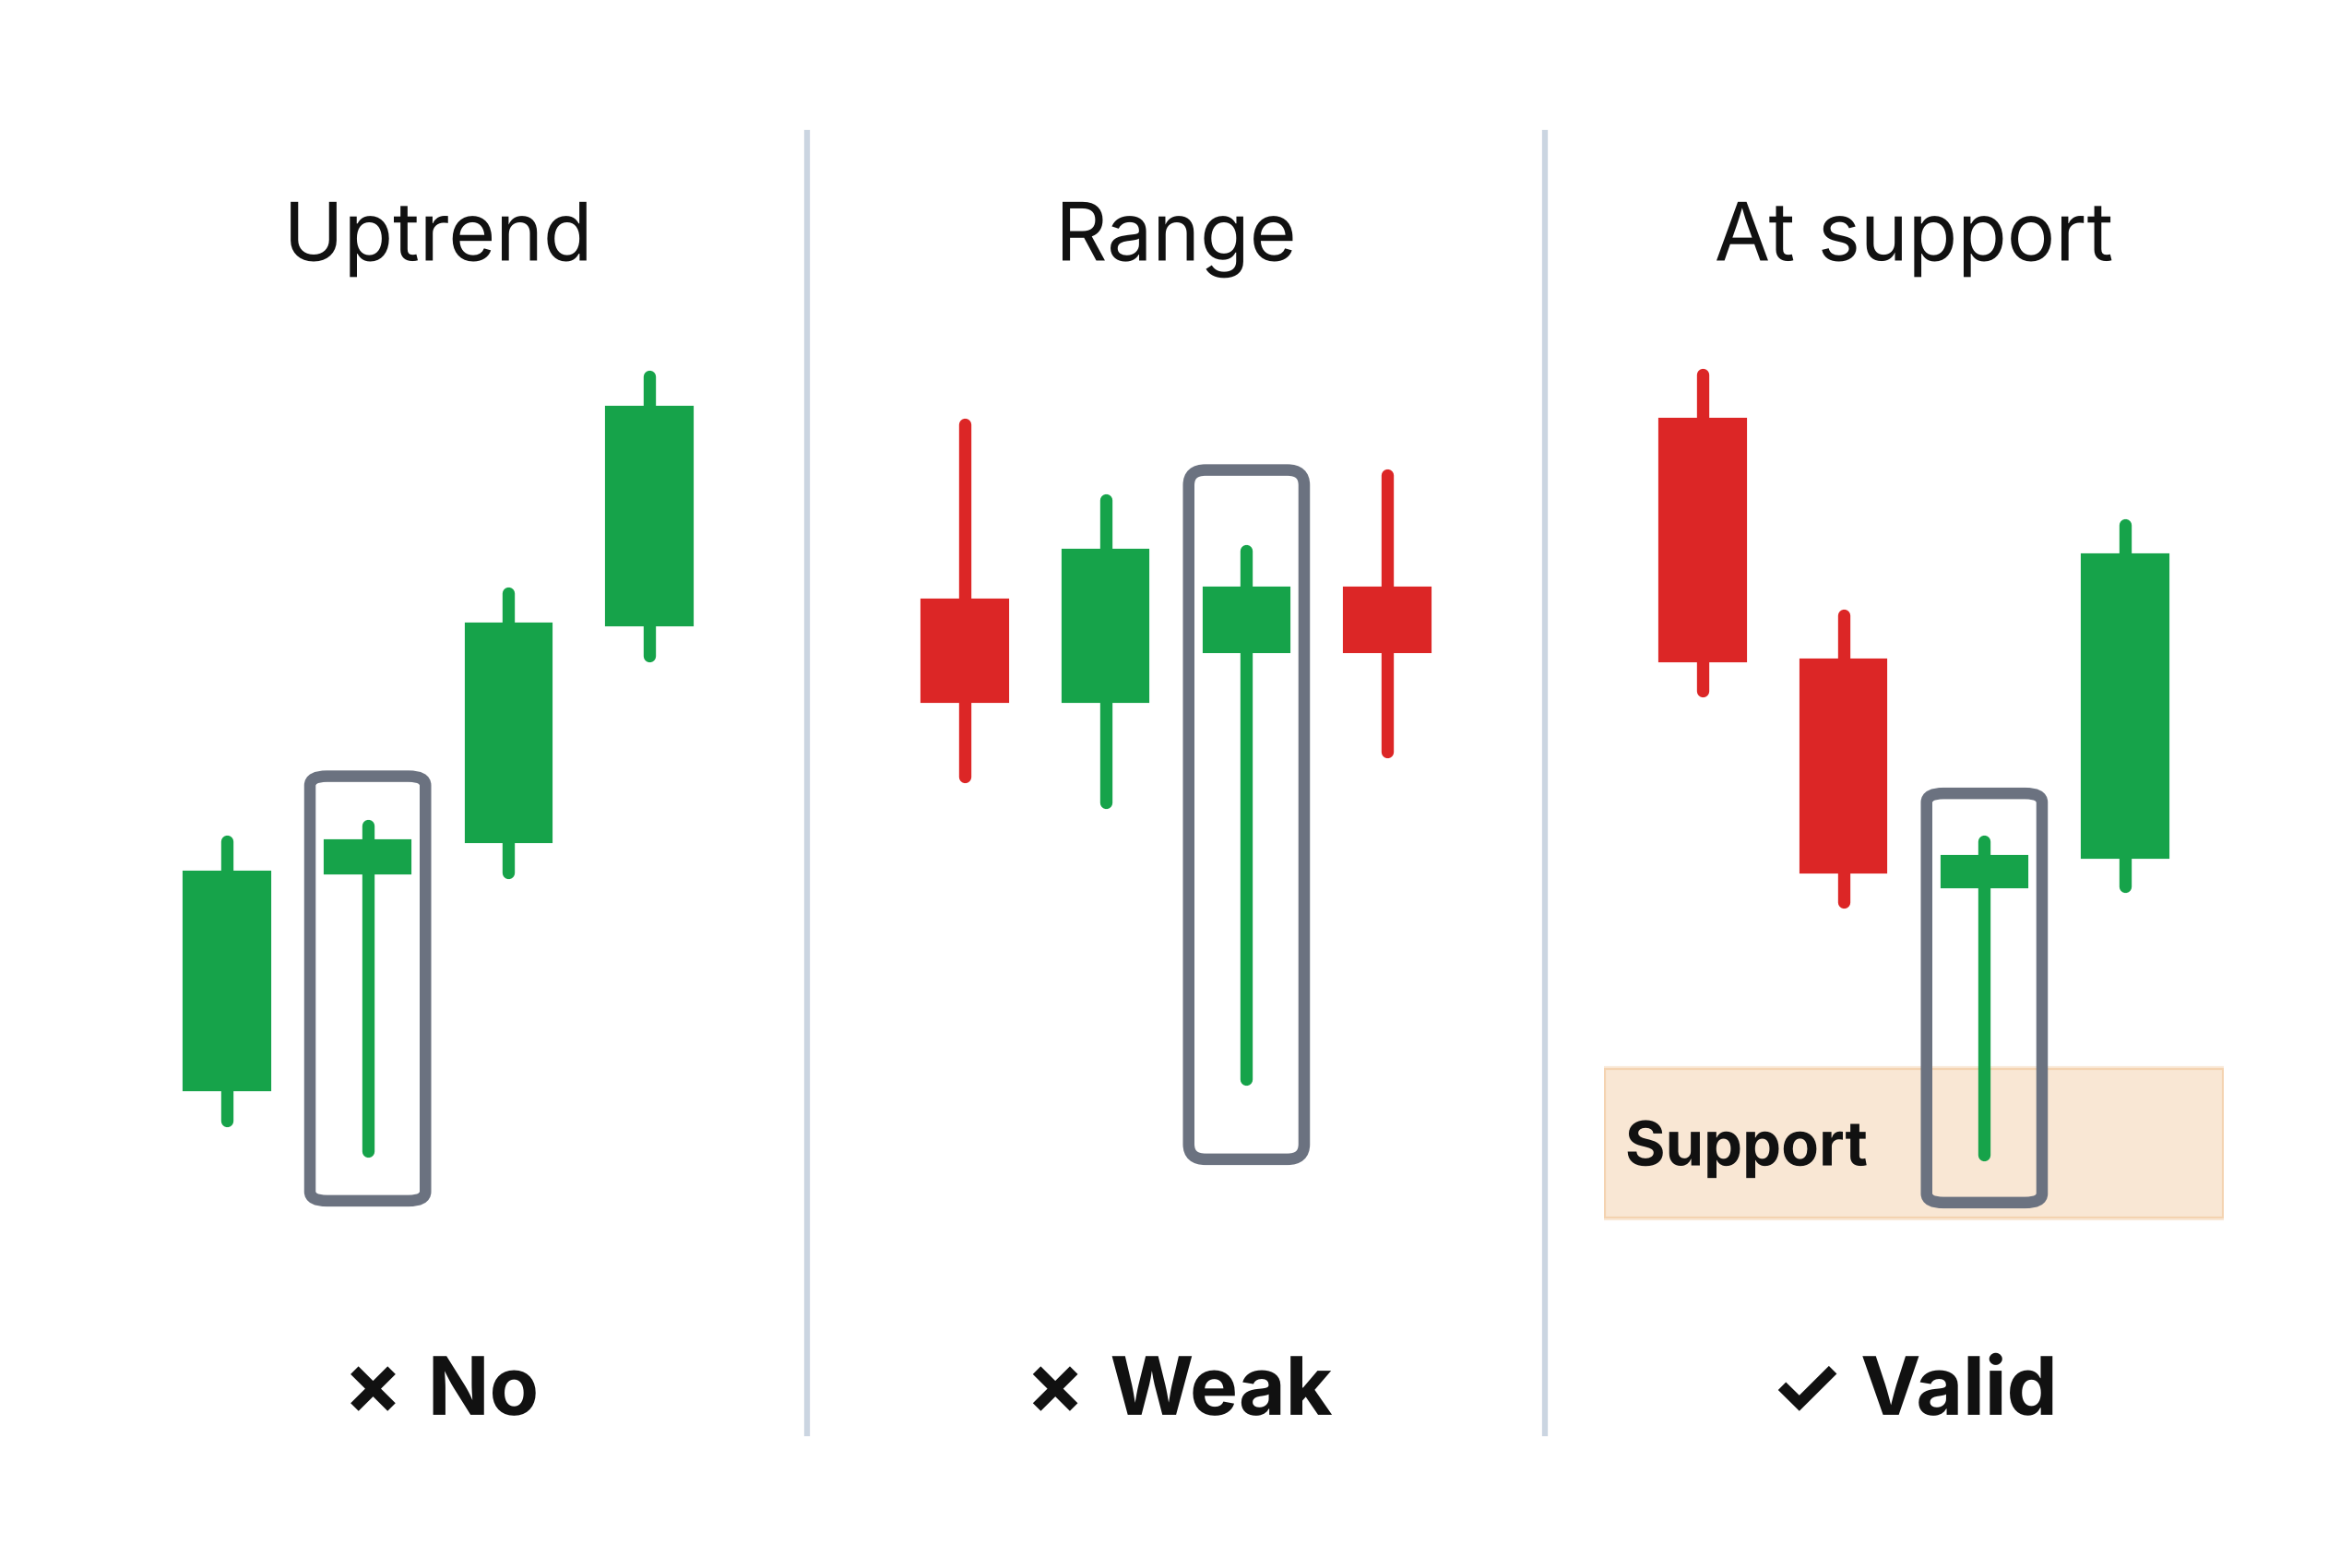
So when traders see a hammer, expect a reversal, and then watch the price continue to fall anyway, they're left scratching their heads. The pattern looked perfect. What went wrong?
The answer comes down to one concept: a strong support area.
Market sentiment doesn't flip on a whim. It only shifts when there's a significant imbalance between the number of buyers willing to step in and the number of sellers willing to push prices lower. That imbalance doesn't just happen randomly in the middle of a chart. It tends to happen at specific, identifiable price levels — areas where buyers have historically shown up in force.
A strong support zone is exactly that kind of area. It's a price level where demand is high, where buyers have previously defended their positions, and where there simply aren't enough sellers left to drive prices any further down. When a hammer forms at one of these levels, you're not just seeing a shape — you're seeing the market respond to a meaningful battlefield.
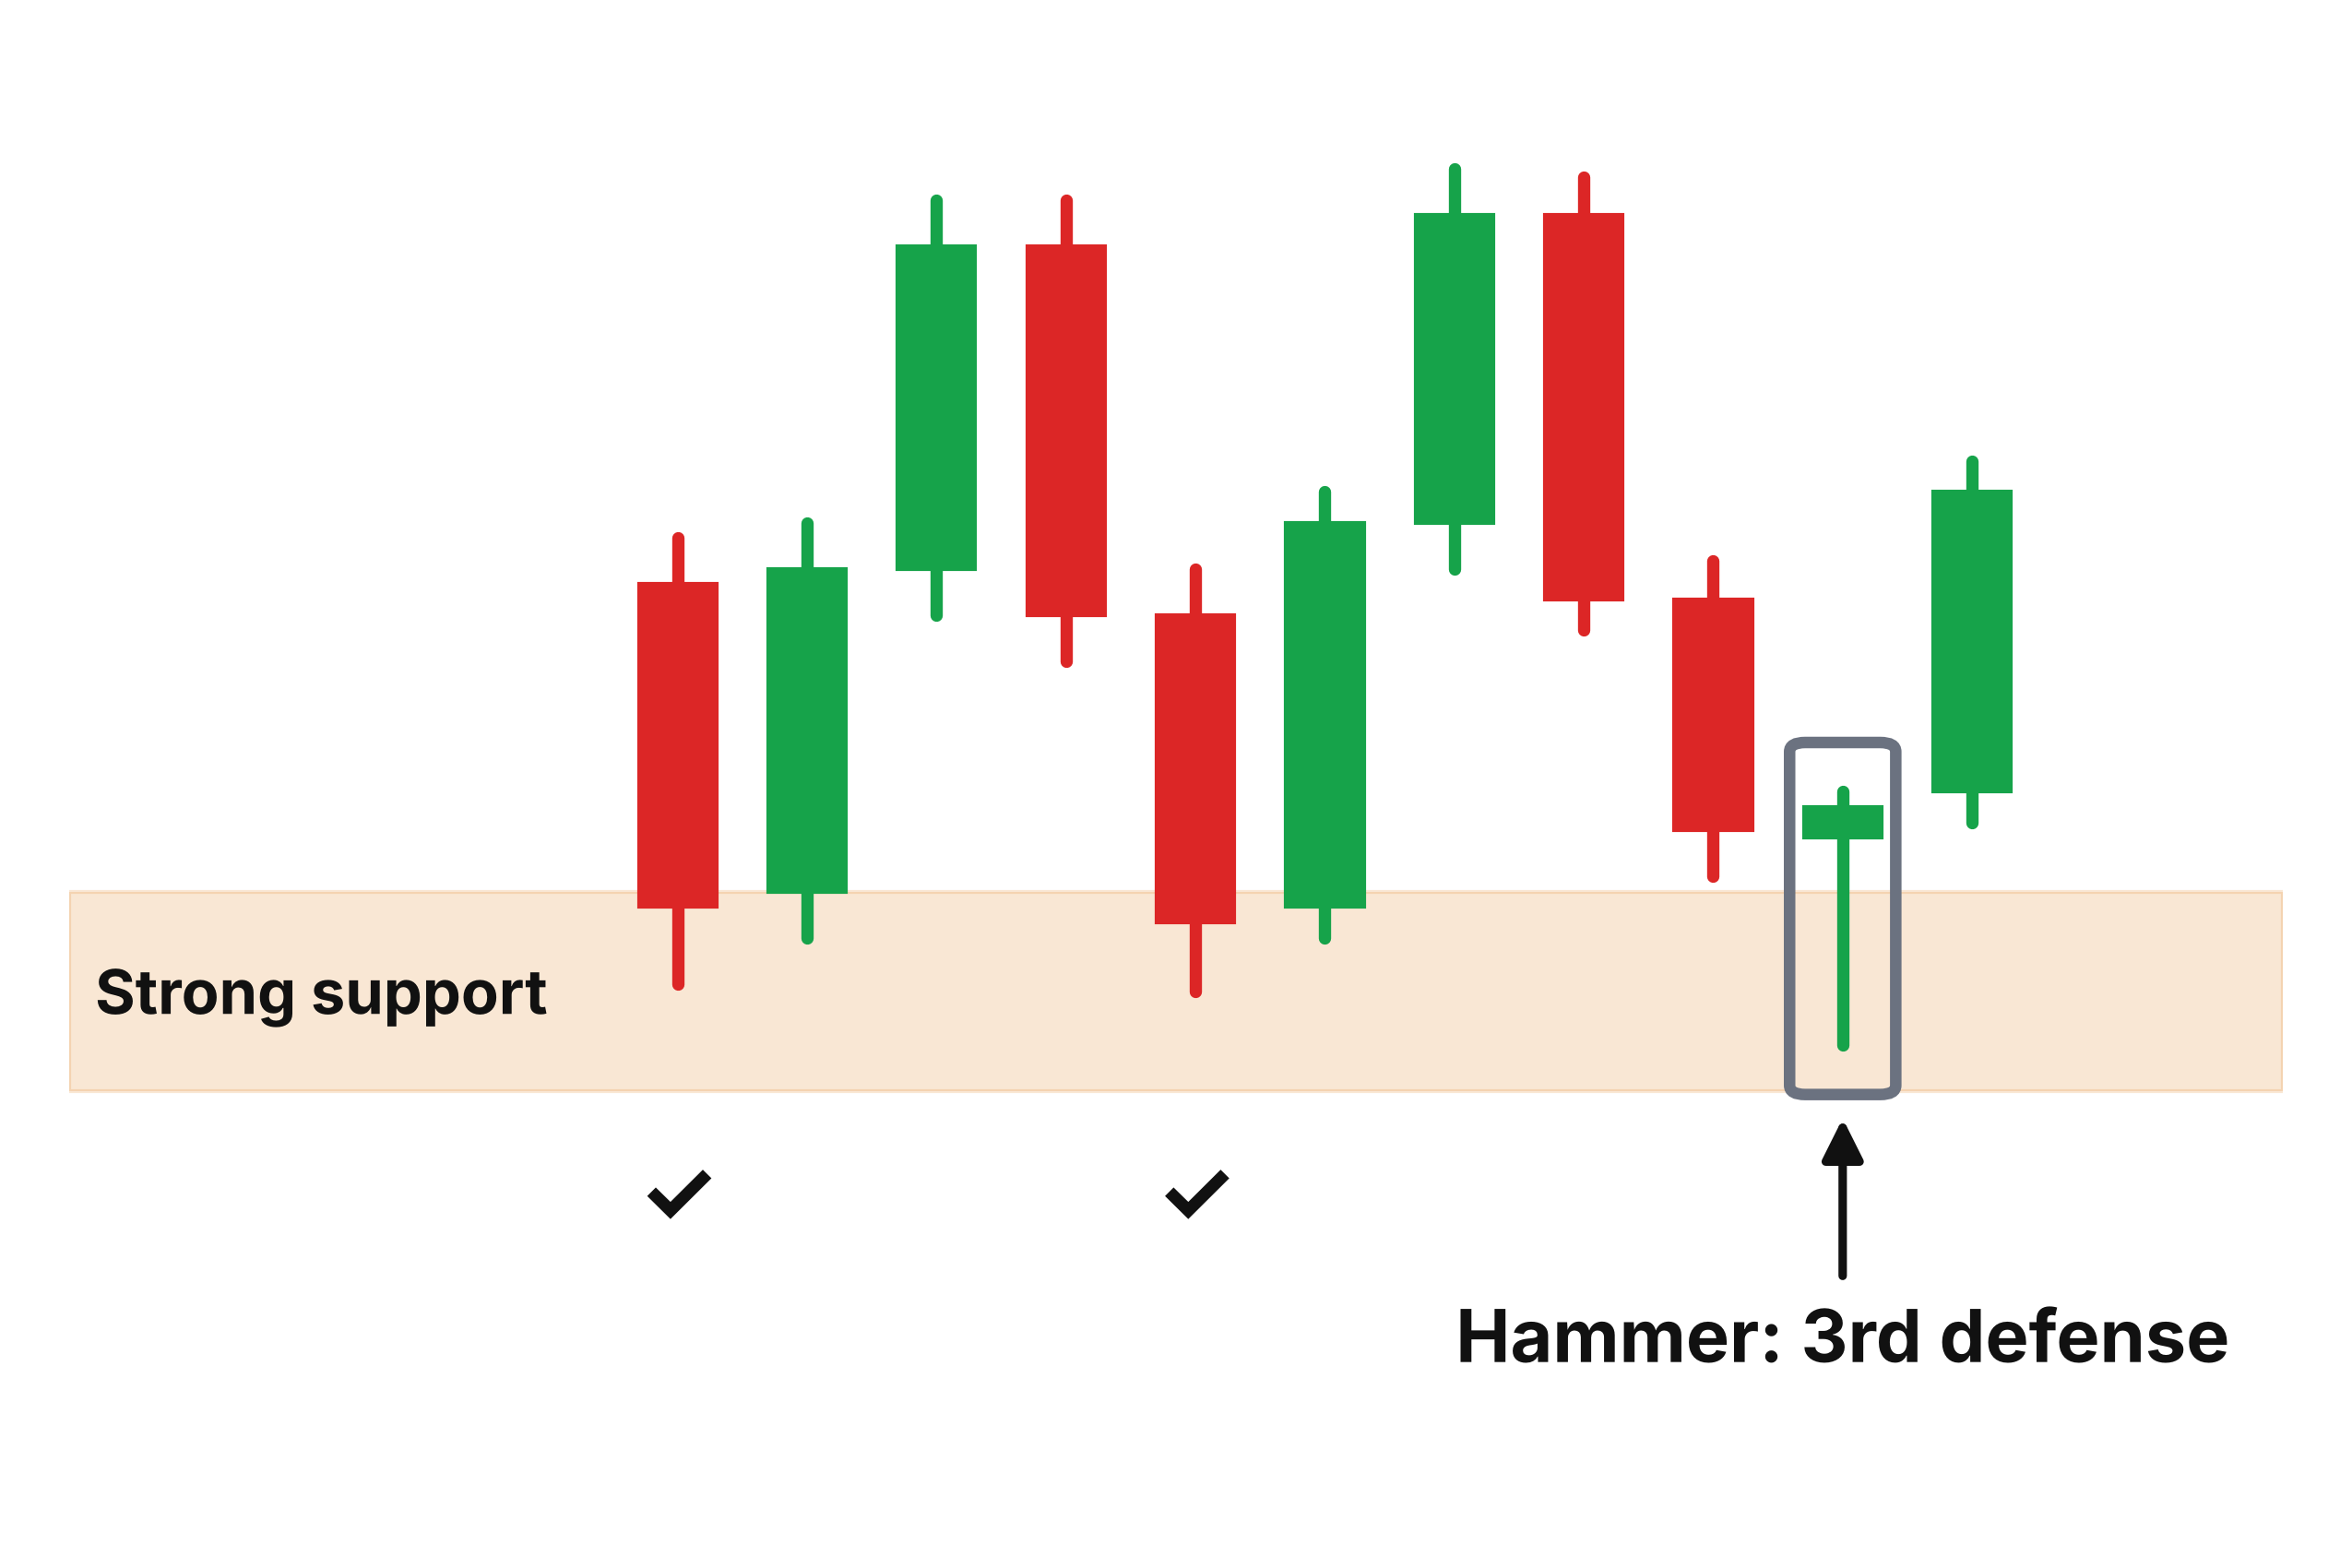
That's the rule: a hammer pattern only becomes truly meaningful when it forms near or inside a strong support area. Outside of that context, it's just a candle.
How the Hammer Actually Forms: Two Events, One Story
Understanding why the hammer looks the way it does makes it far easier to trust when you see it. The shape isn't random — it's the direct result of two specific things happening during a single trading session.
The first event: heavy selling pressure early in the session.
This part makes perfect sense when you think about it. Hammer patterns tend to appear at the tail end of downtrends, which means bearish momentum is often still running strong. Sellers are in control. Fear is in the air. So when the session opens, the selling continues — and the price drops. Sometimes sharply. The candle extends its wick downward as the bears push and push, looking for more capitulation from buyers.
If you were to zoom into a smaller time frame during this period, you'd often see what looks like a mini crash unfolding in real time — price cascading lower, sellers piling on, no sign of a floor.
And then something changes.
Buyers start to step in. Quietly at first, then with more force. They begin absorbing the selling, placing orders, and pushing back. If you watch it happen on a smaller chart, it often looks like a V-shaped recovery — a rapid, sharp reversal from the session lows back upward. The selling pressure that seemed unstoppable hits a wall, and the wall holds.
The second event: the closing price.
This is what completes the hammer and gives it its power. If the price closes near or slightly above where the session opened, the candlestick takes on that iconic hammer shape — a small body at the top and a long lower wick trailing down where sellers tried and failed to hold ground.
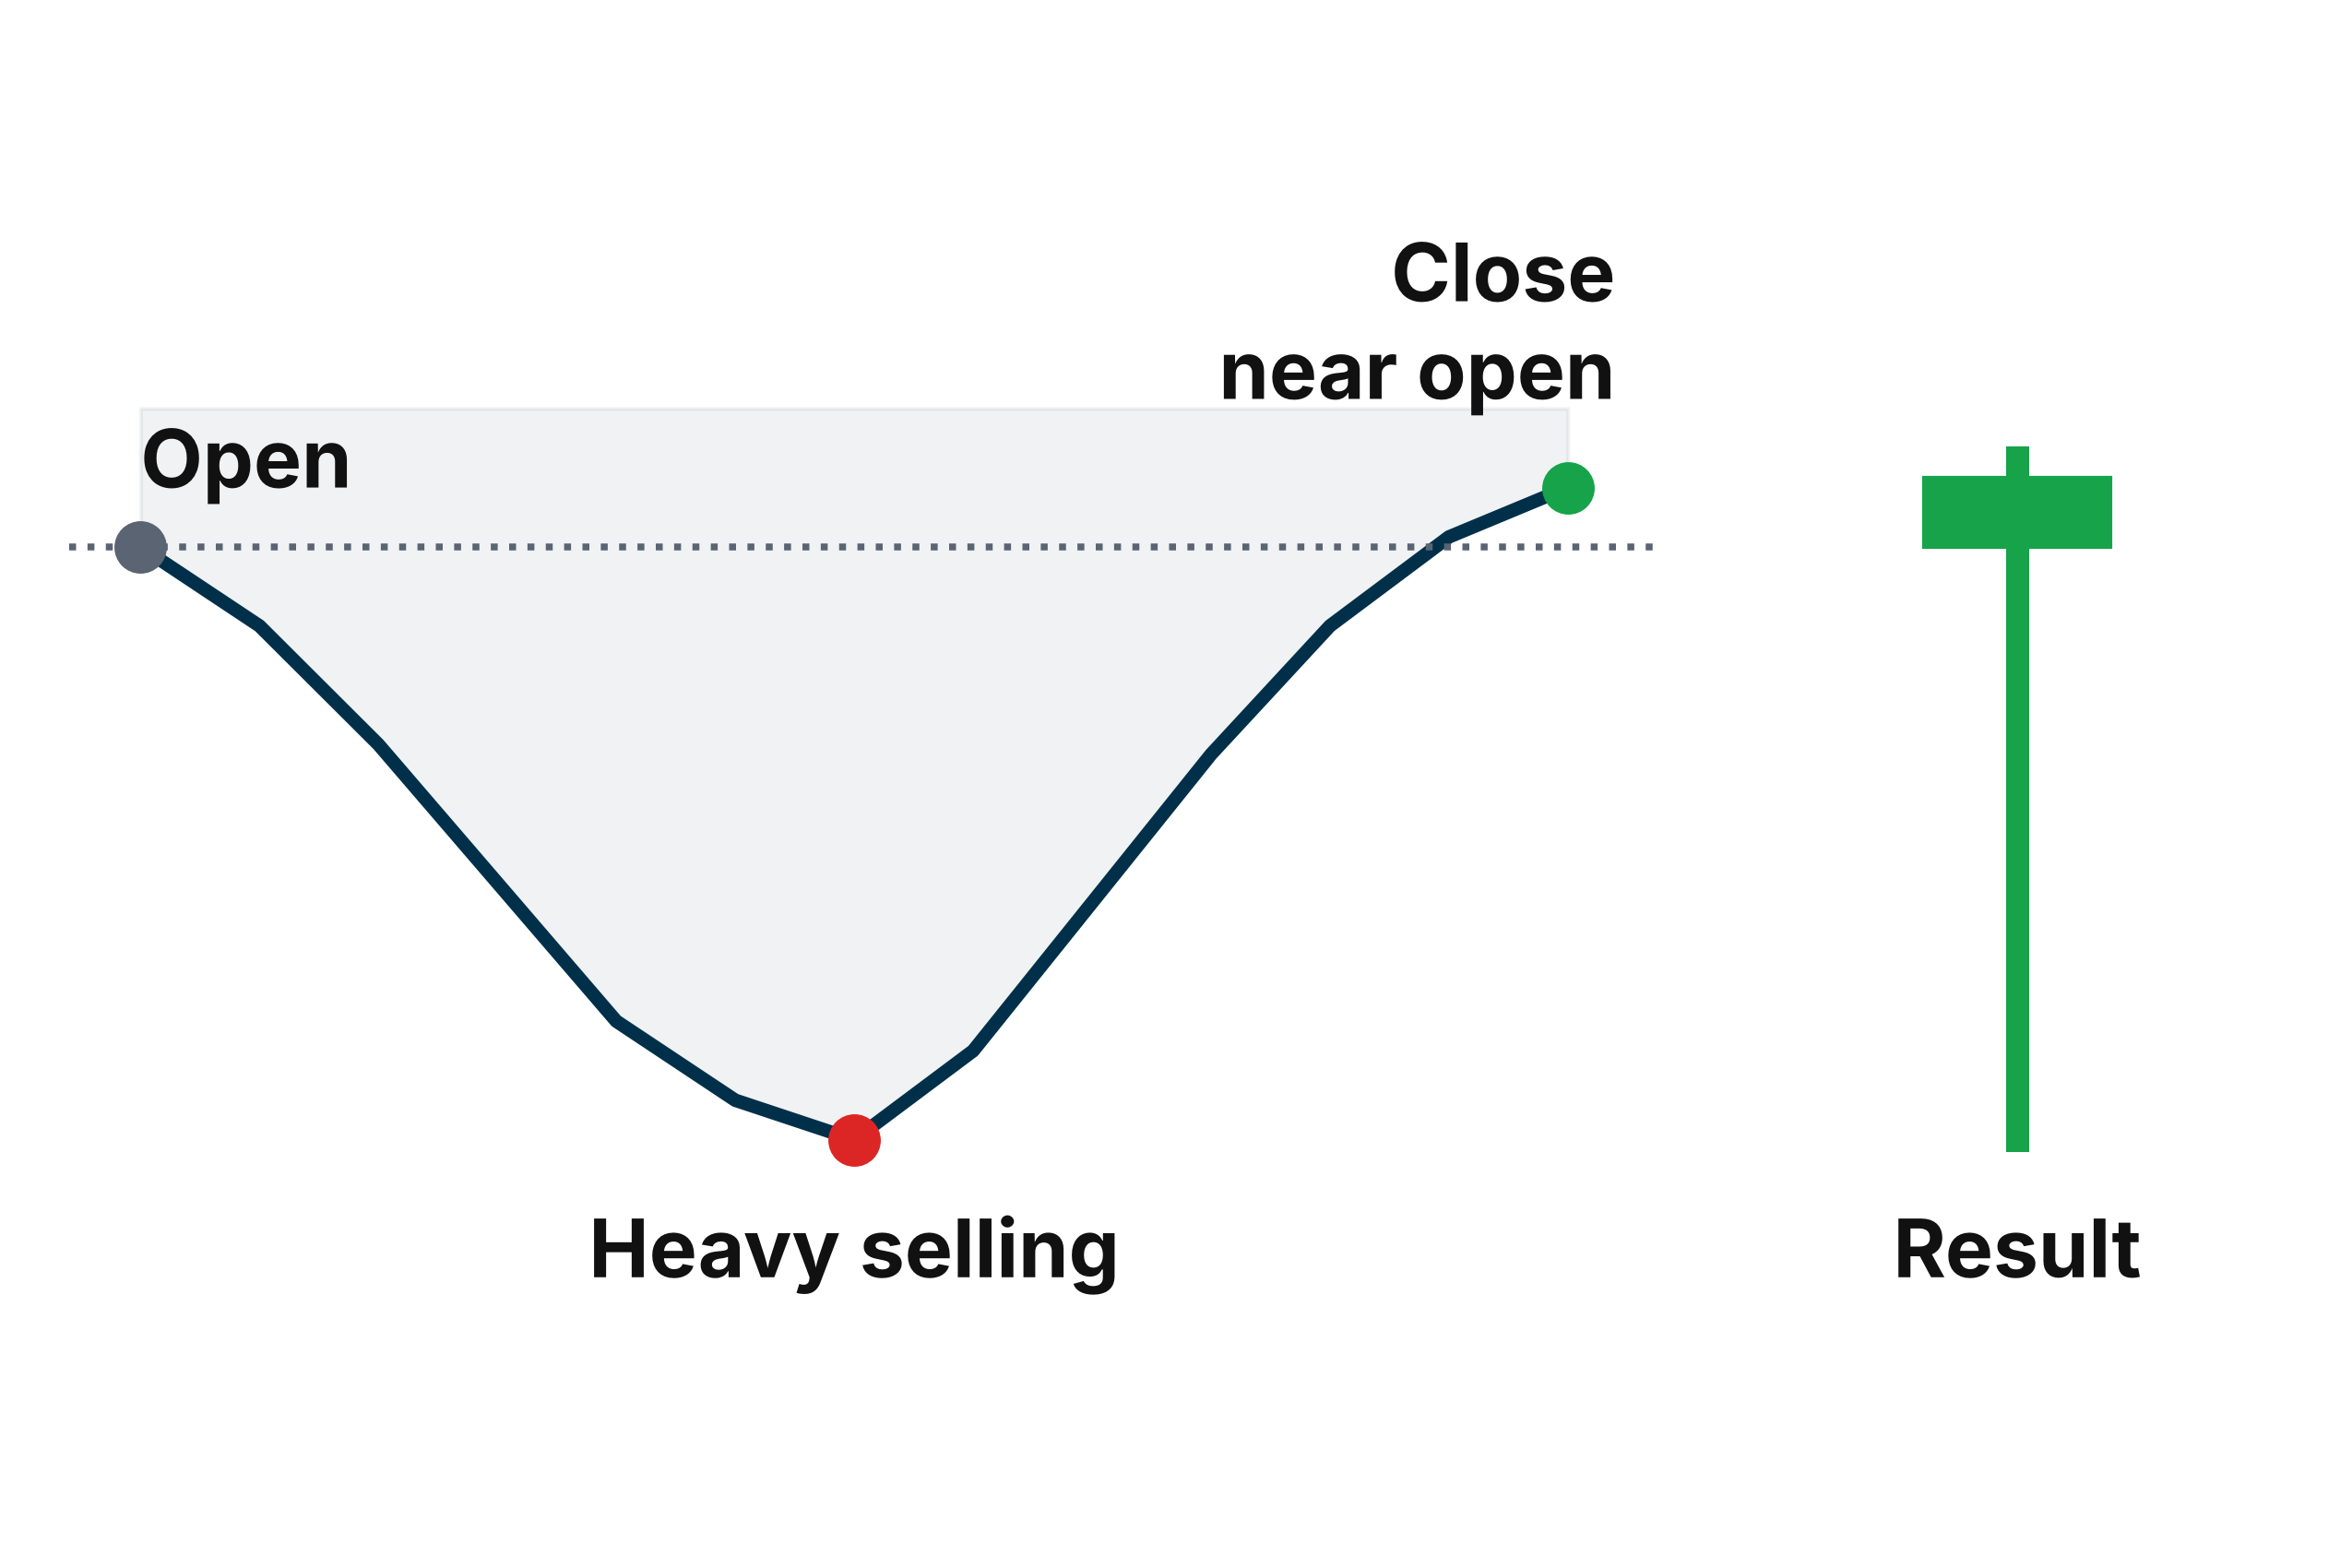
What that closing price is telling you is profound. It means that despite everything the bears threw at the market during that session — all the selling, all the downward pressure — the bulls absorbed it, fought back, and brought the price back up. They didn't just survive. They won the session.
That's a statement. The bears are losing their grip, and the bulls are beginning to assert control.
And here's a detail worth remembering: the longer that lower wick, the stronger the signal. A short wick means buyers pushed back a little. A long wick means buyers pushed back hard — absorbing massive selling pressure and still closing near the open. When you see a hammer with a wick that stretches two, three, or even four times the length of the body, that's a candle telling you the buying conviction at that level was serious.

Who Benefits — and How
Now that you understand what the hammer is and what it means, the practical question becomes: how do you actually use it?
The answer depends on where you sit as a trader, because the hammer speaks differently to different people.
If you have short positions:
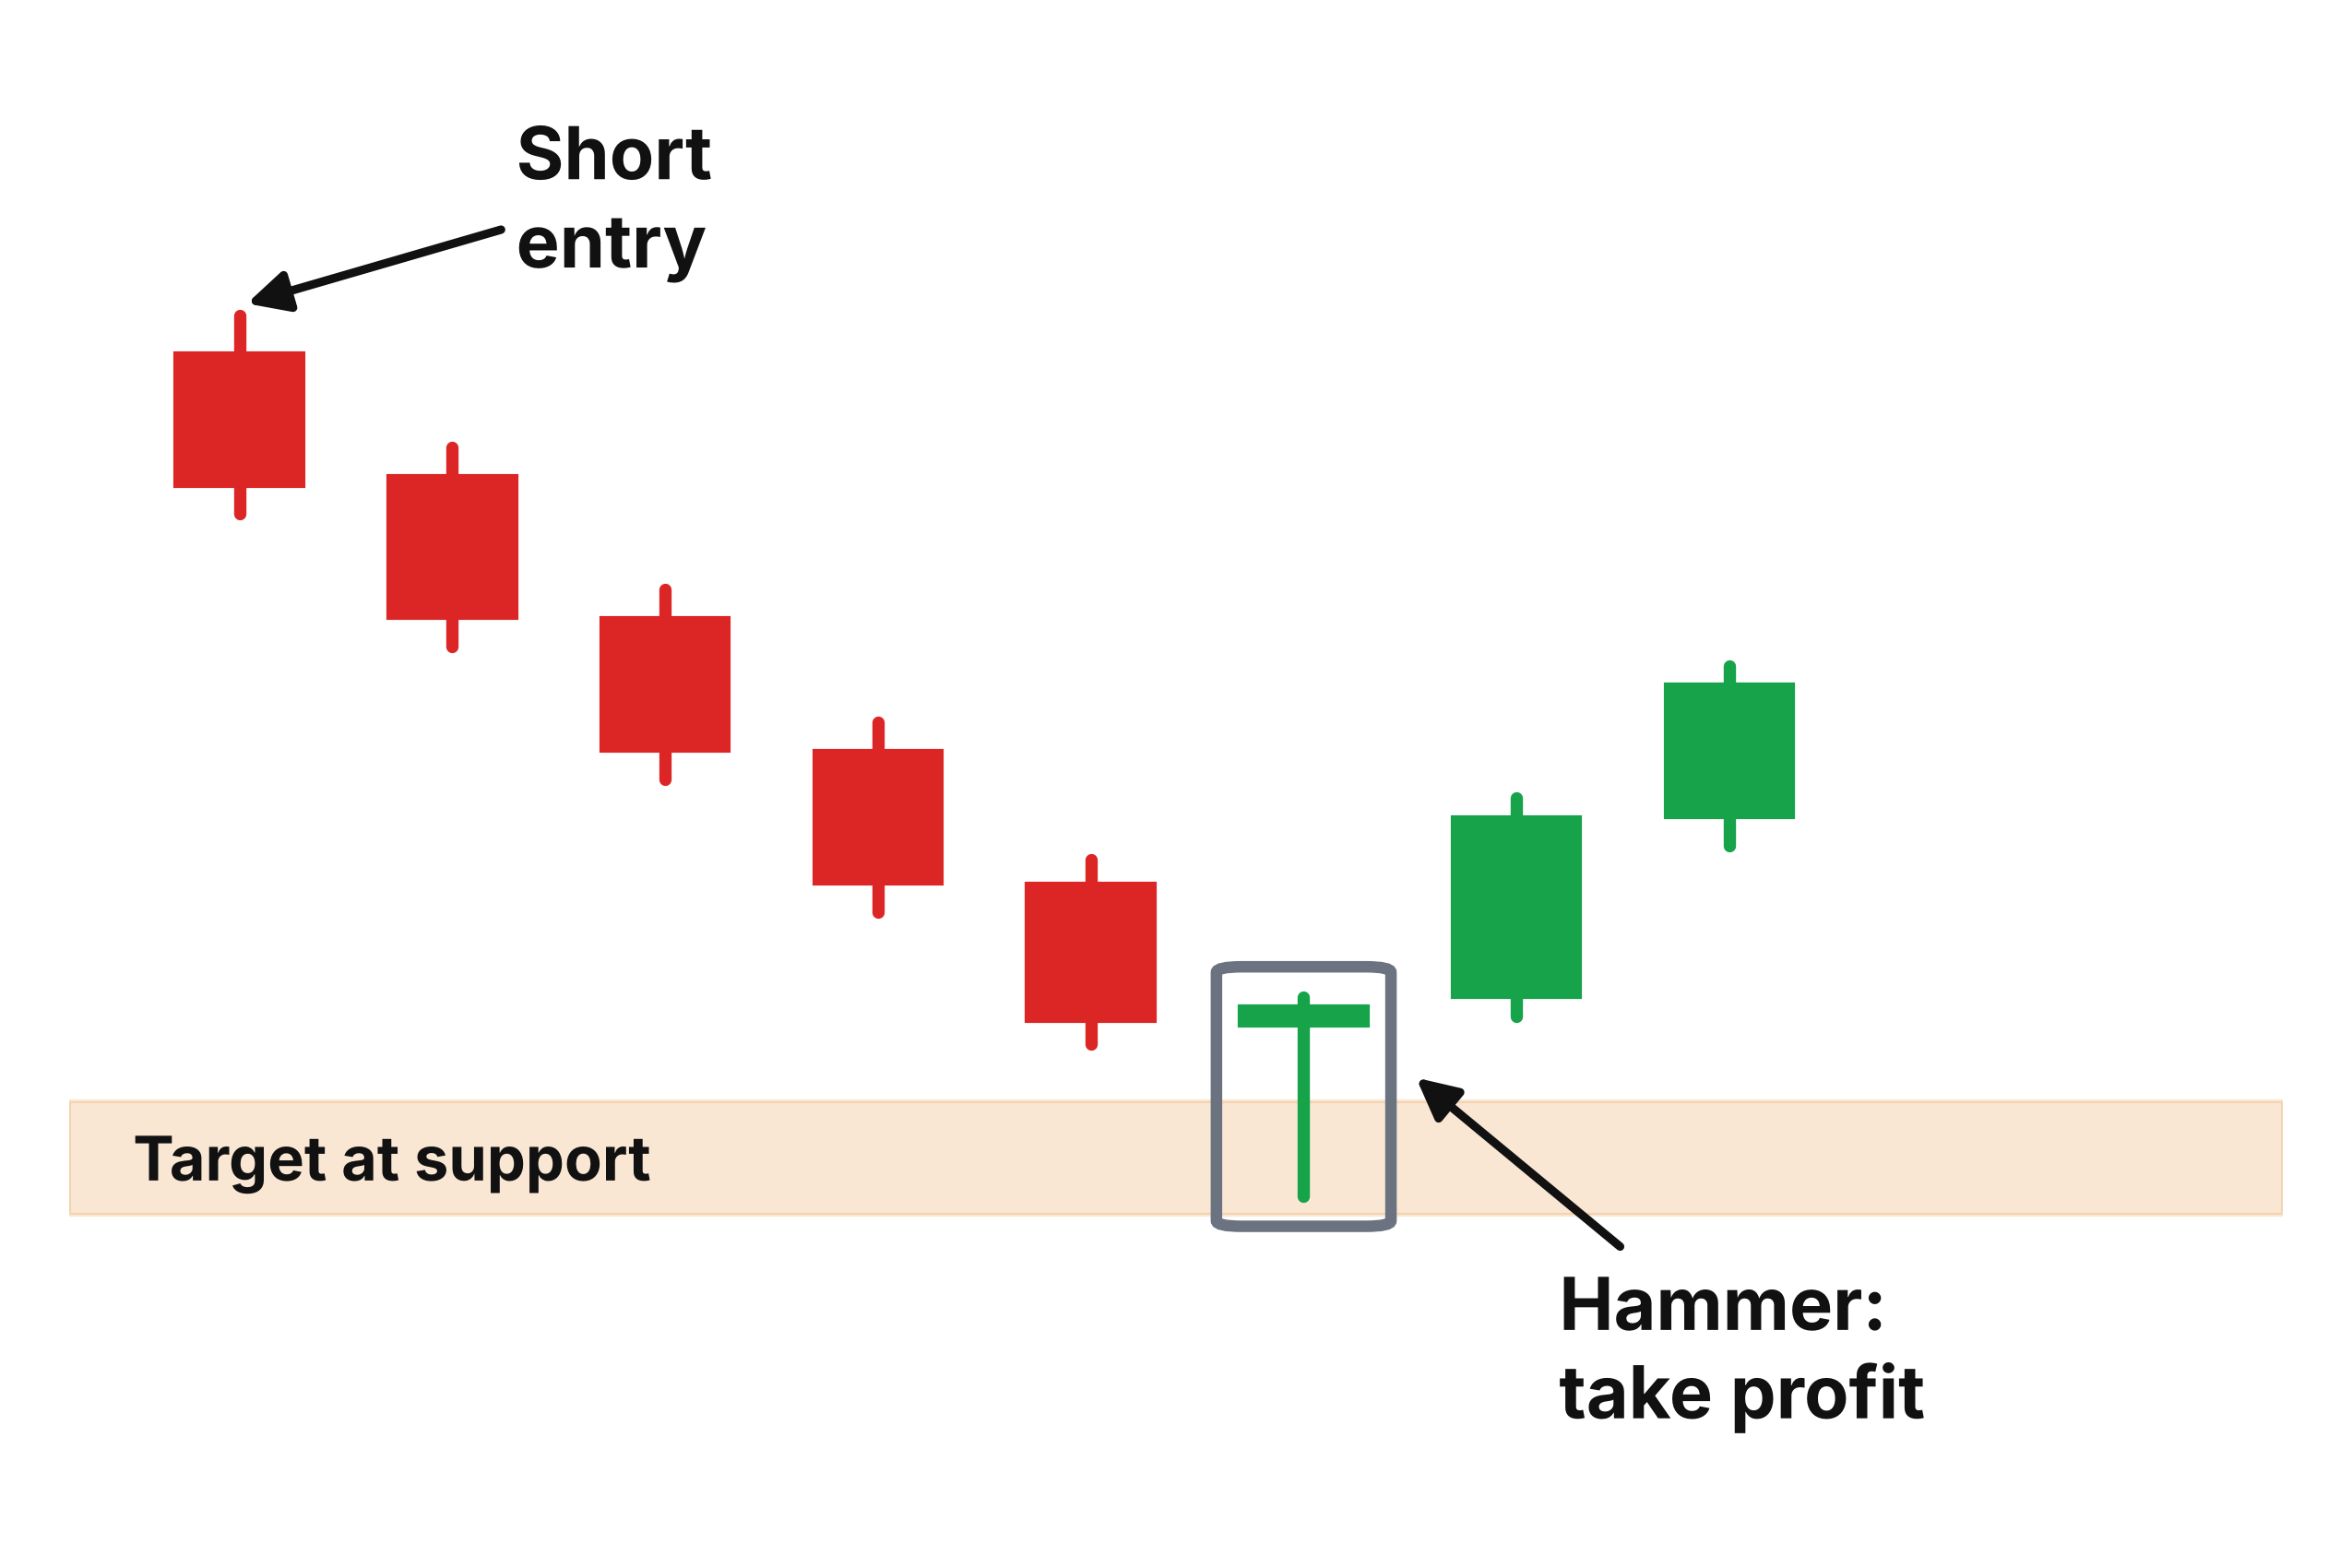
For traders who profit from downtrends by short-selling, the hammer is your early warning signal. It's the market's way of tapping you on the shoulder and saying, " The move might be over.” If you've been riding a stock lower and a hammer forms at or near your profit target — which, if you're trading with a plan, you've already set near a strong support area — that pattern is your confirmation to close the trade and lock in your gains. You're not guessing anymore. The market is showing you the shift before it fully plays out.
If you're looking to go long:
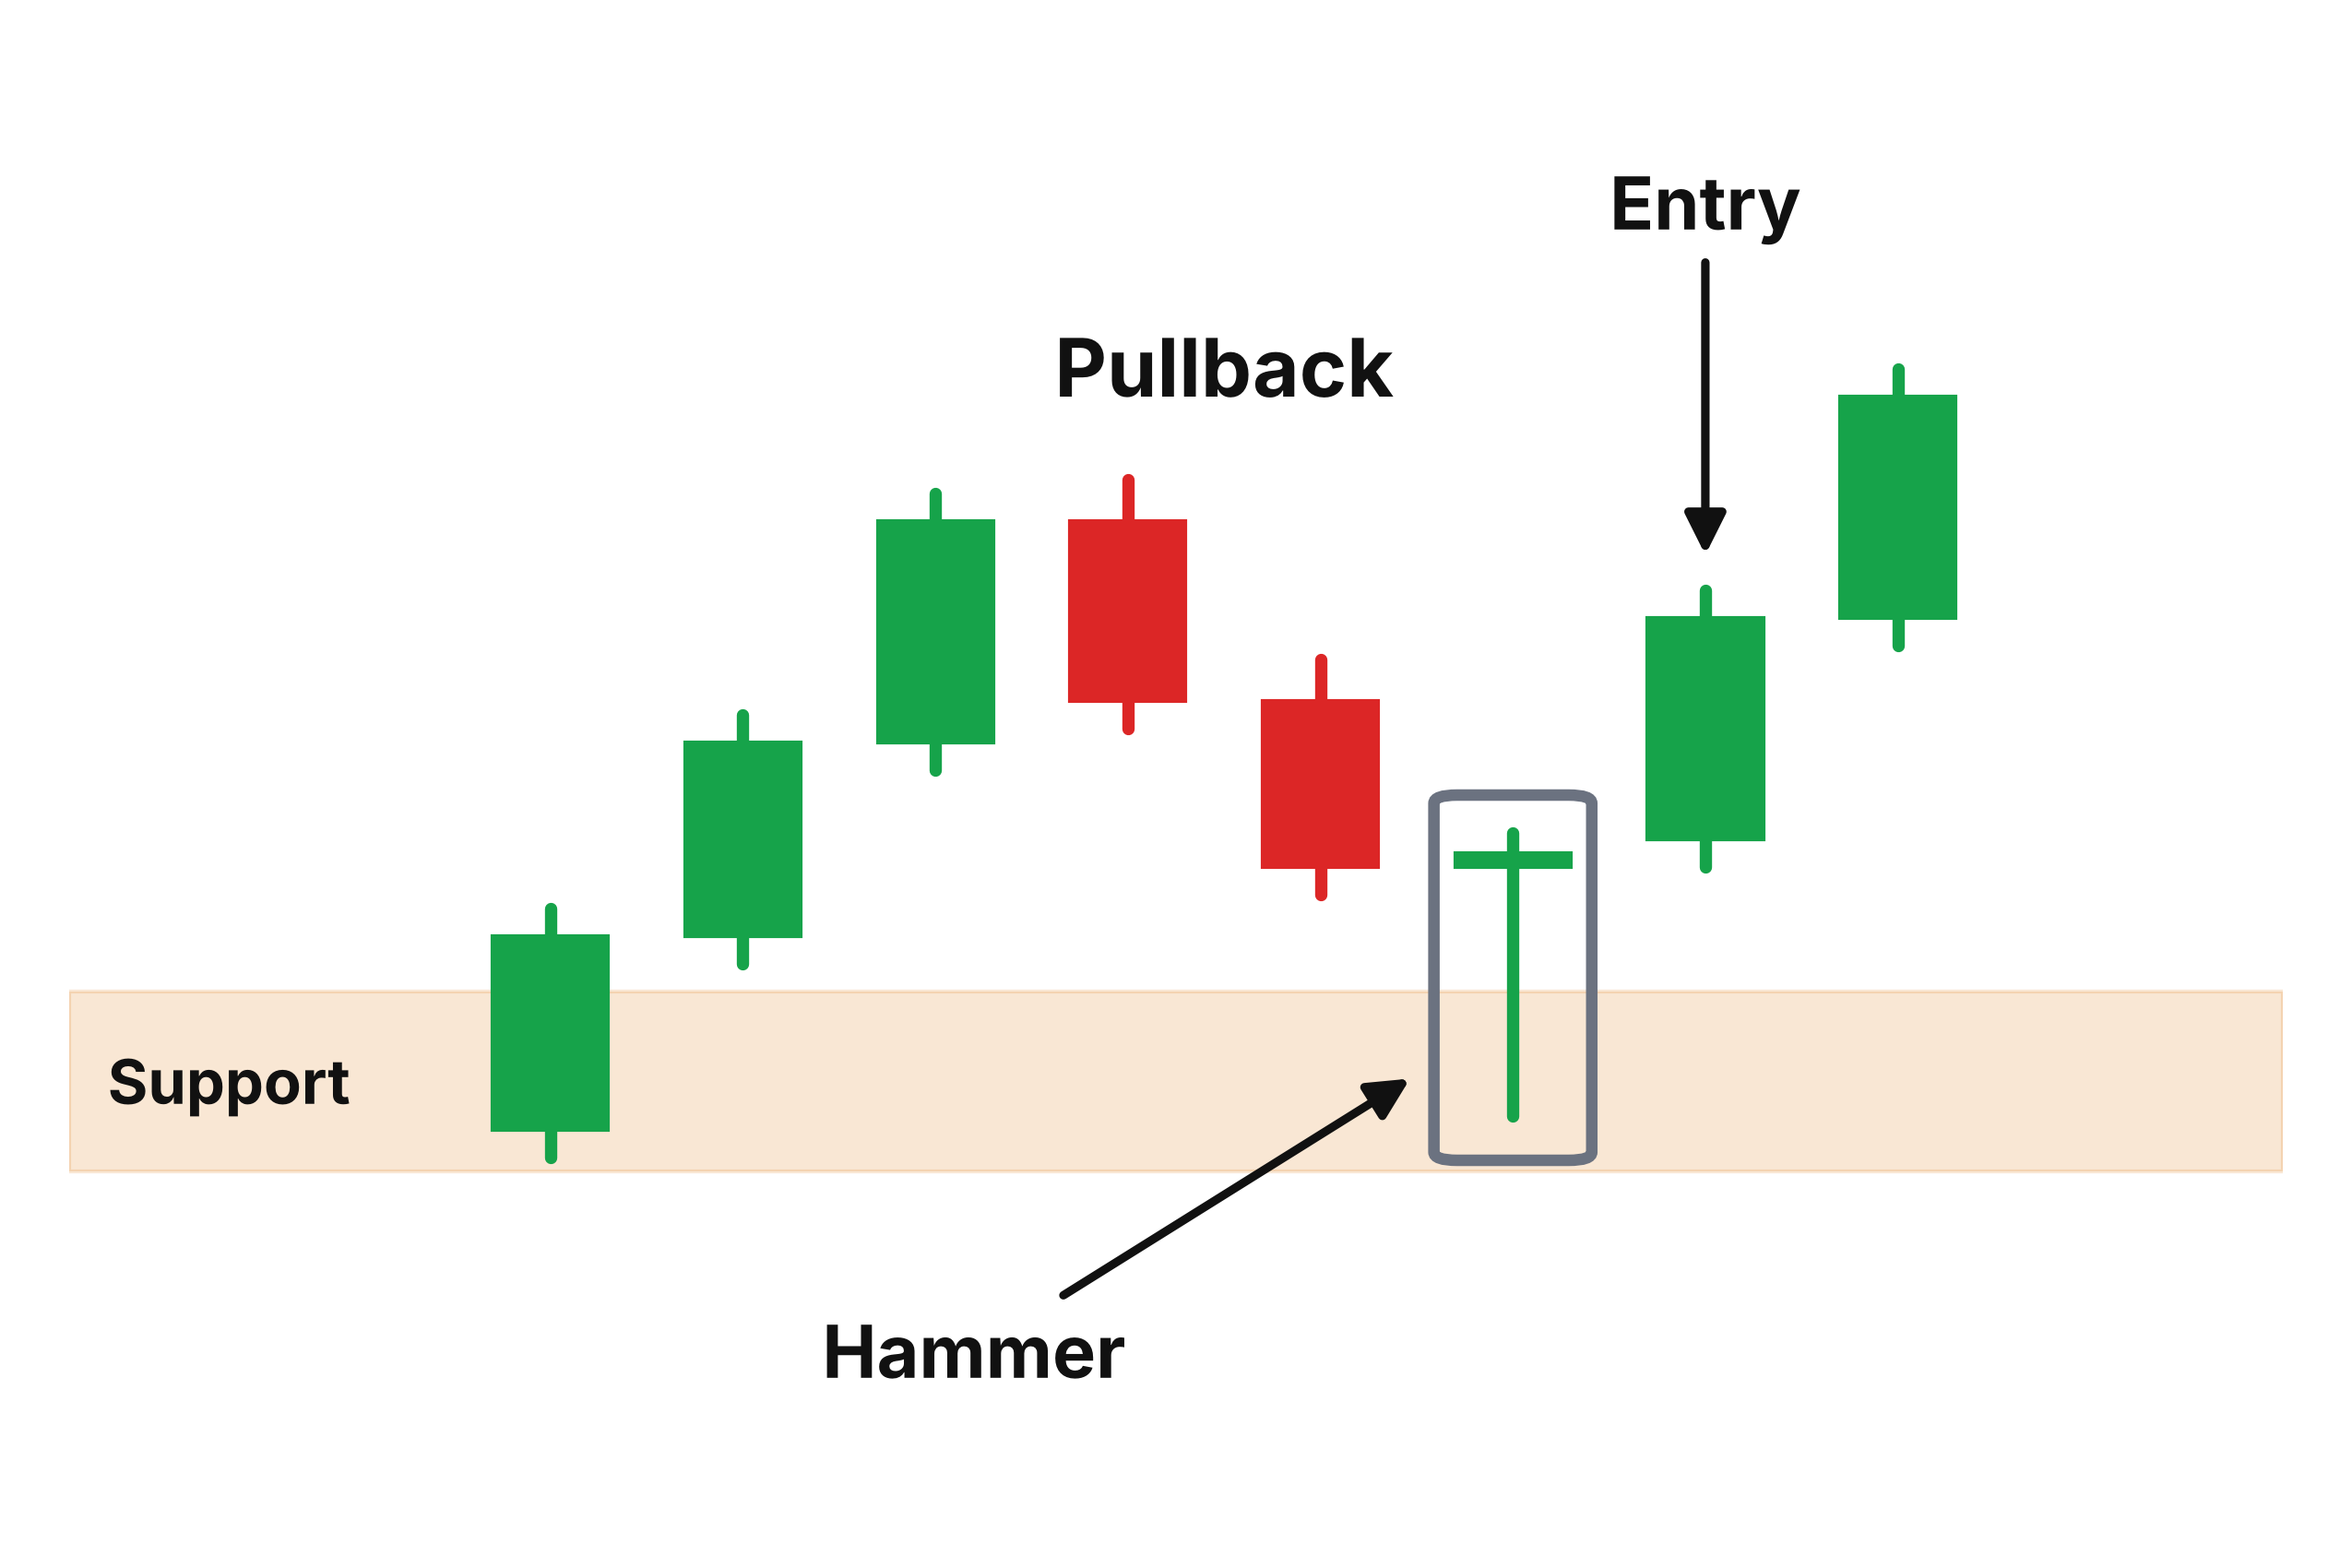
For buyers hunting entry points, especially during a pullback in a broader uptrend, the hammer is one of the cleanest confirmation signals available. When price pulls back into a support zone and a hammer forms, it's telling you that support is holding and that bullish sentiment is beginning to return. Instead of trying to catch a falling knife — which every trader has done at least once, and regretted — you wait for the hammer to fully form. Then you have evidence of a reversal, not just hope. It becomes a high-probability entry that aligns with the overall direction of the new emerging trend — and more importantly, it gives you a chance to get into a bullish trade before most other traders even realize a reversal is happening. That's the edge. While others are still waiting and not sure, you're already positioned.
If the market is moving sideways:
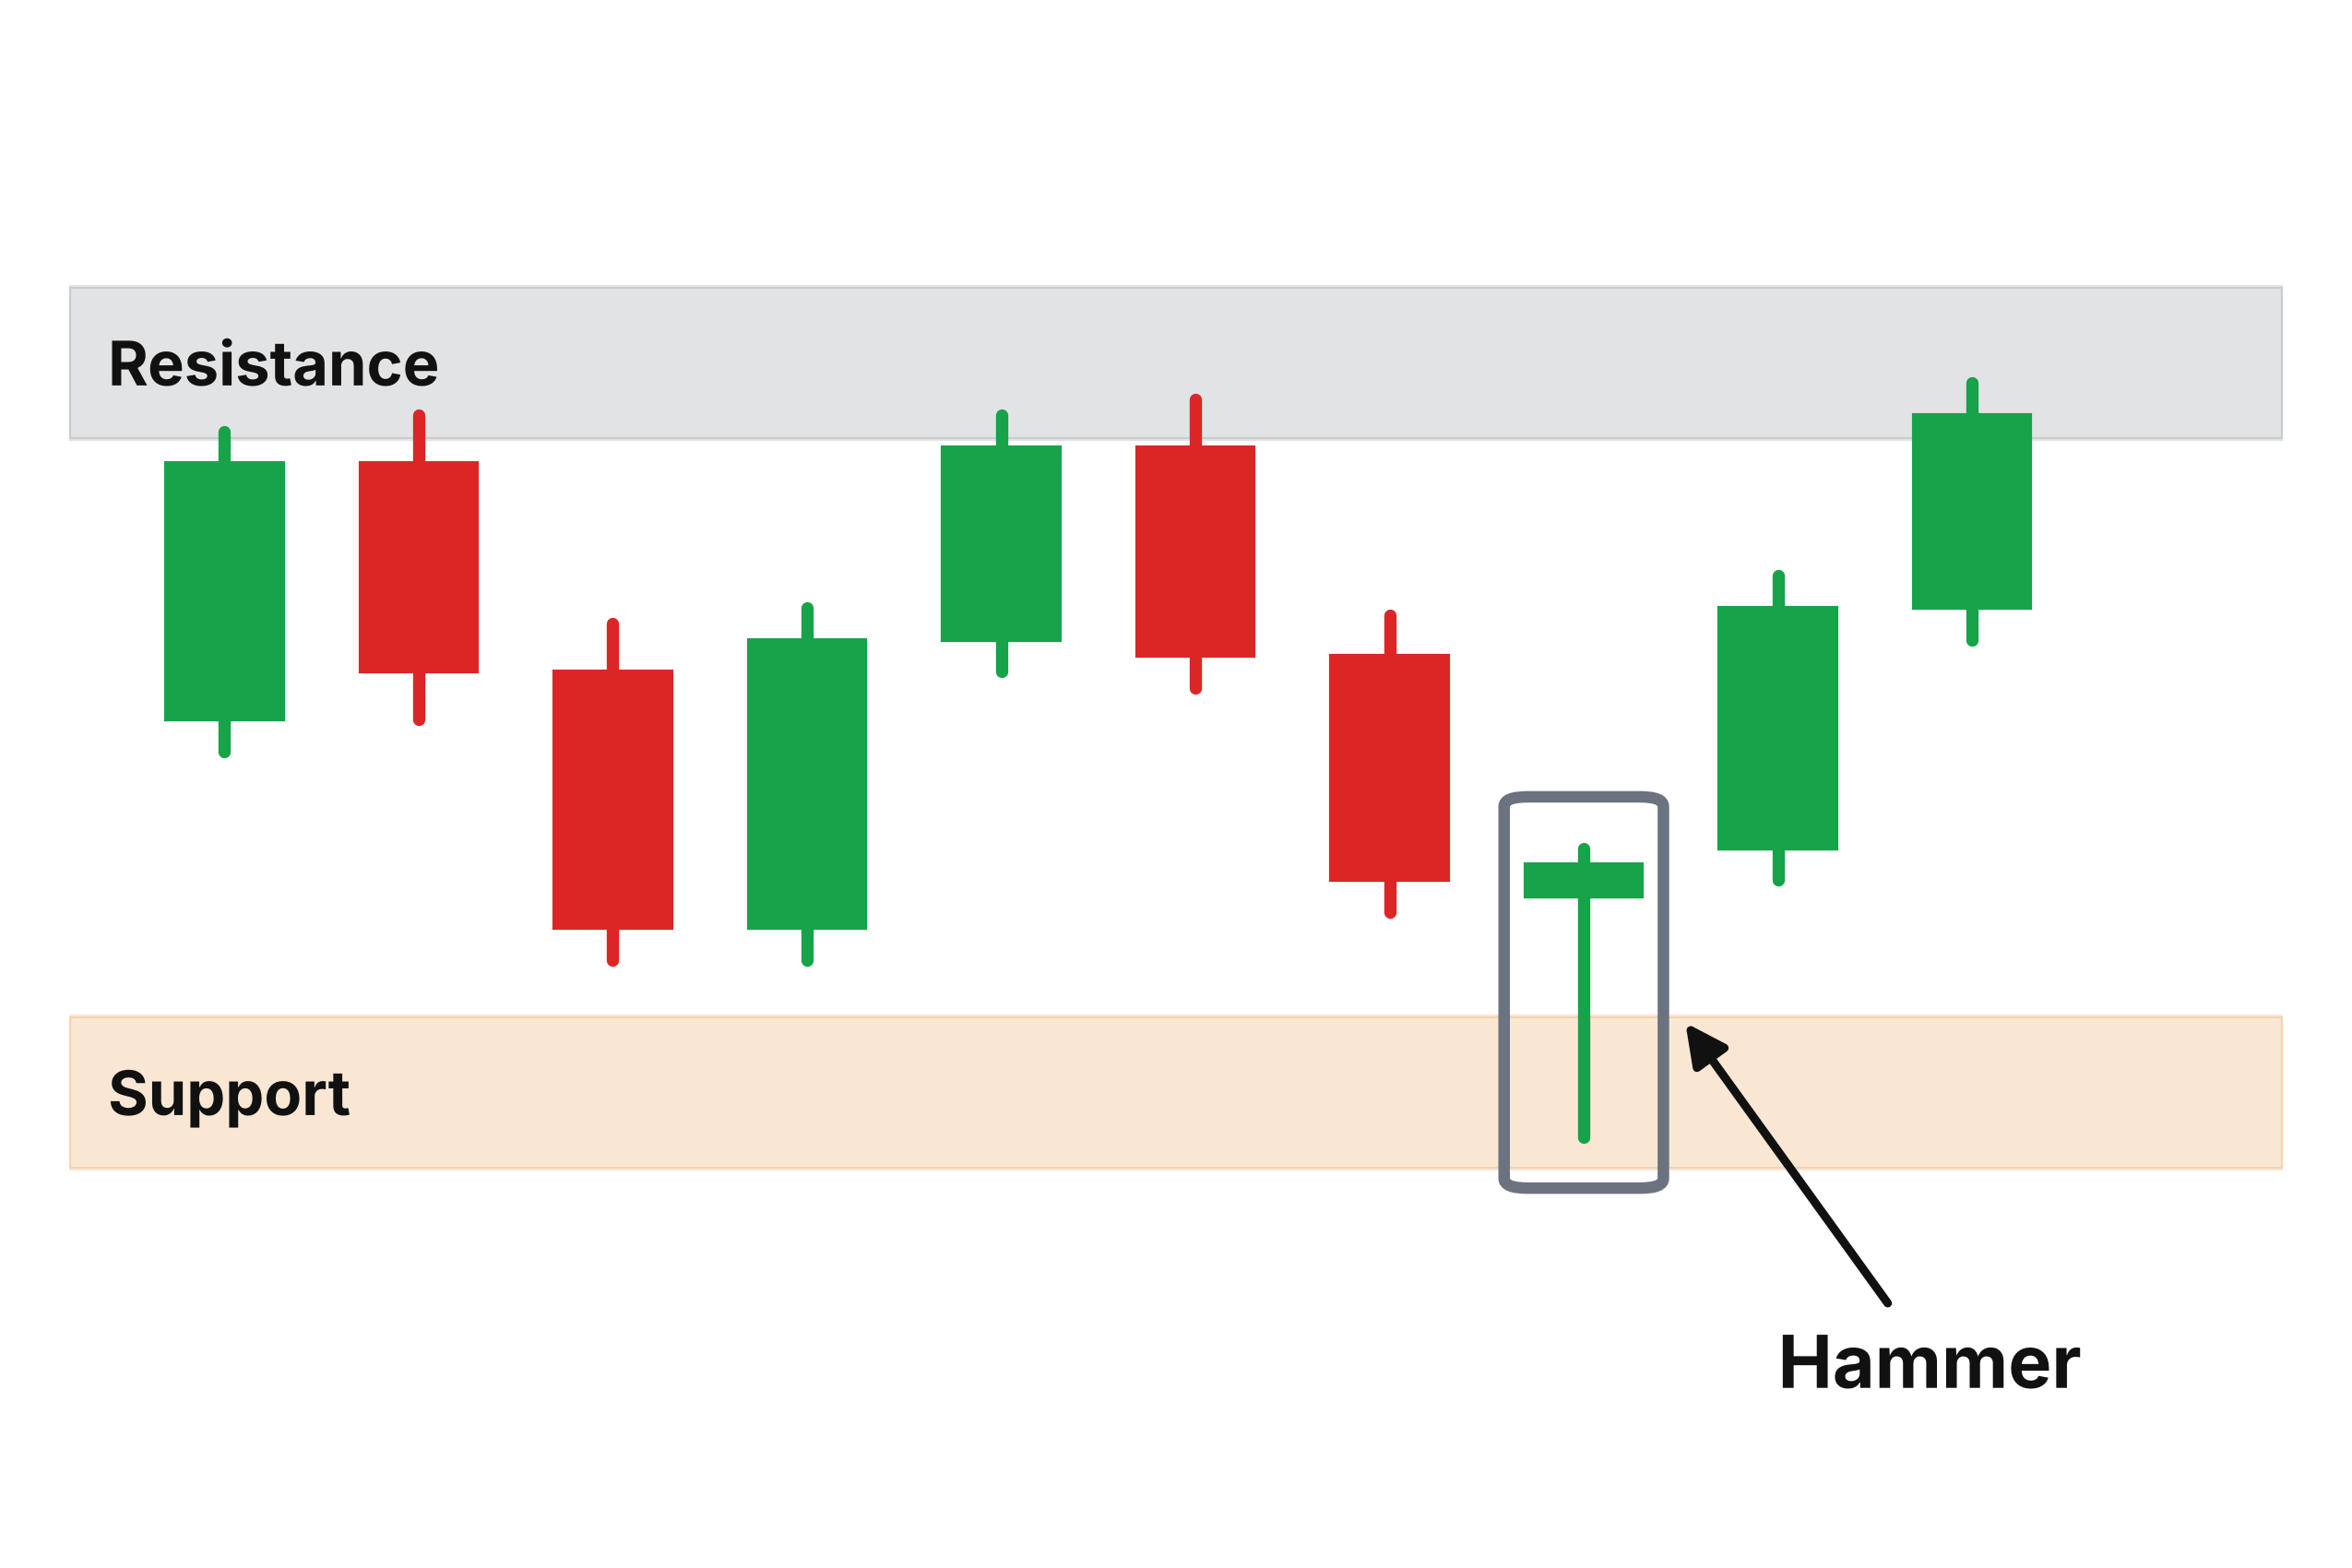
Range-bound markets have their own rhythm — price bouncing back and forth between an established support and resistance, with neither bulls nor bears gaining lasting control. The hammer fits naturally into this environment, too. When price drifts back toward the lower end of the range and a hammer forms at that support level, it often signals the start of the next bounce toward resistance. Even in a choppy, directionless market, the hammer can give you a precise entry point rather than guessing somewhere in the middle of the noise.
A Pattern Rooted in Market Psychology
It's worth stepping back for a moment and appreciating what makes the hammer work at a deeper level. Technical patterns aren't magic — they work because they reflect real human behavior, real decisions made by real market participants under real conditions.
When a hammer forms at support, here's what's actually happening: sellers who were confident enough to push prices down are now running out of willing participants. The buyers who'd been sitting on the sidelines, waiting for a price level they believe represents genuine value, start placing buy orders. The two forces collide. And because that particular price area has historically attracted buyers — that's what makes it a support zone in the first place — the buyers win that session.
The hammer is the footprint of that battle. The long wick is evidence of how far sellers pushed before buyers turned them back. The close near the open is the scoreboard at the end of the fight.
That's why the pattern tends to work — it isn't just a shape on a screen. It's a record of what actually happened between bulls and bears during that window of time.
Final Thoughts: A Simple Tool With Real Edge
Of all the candlestick patterns in technical analysis, the hammer stands out for its simplicity without sacrificing reliability. You don't need to memorize complex combinations of candles. You don't need to cross-reference five different indicators. You need to find a strong support area, wait for the price to reach it, and watch for a single candle with a small body and a long lower wick to tell you what the market is doing.
That's not to say the hammer guarantees anything — no pattern does. Markets are unpredictable, and risk management will always matter more than any setup. But when the hammer shows up in the right place, it offers something genuinely valuable: an easy-to-spot signal for catching reversals before they fully unfold — one that doesn't require hours of chart study or a dozen confirming indicators to act on.
Every trader, at some point, has missed a great entry because they couldn't tell whether the selling was truly done. They watched the price reverse without them and had to either chase it or let it go. The hammer is one of the tools that helps you stop guessing and start reading. It turns what would otherwise be a nerve-wracking decision into something grounded in evidence.
So the next time a stock you've been watching pulls back into a key support zone, don't rush. Don't panic-buy the first red candle hoping it holds. Wait. Let the session play out. If buyers are truly ready to step up, the chart will show you — in the shape of a small body, a long shadow reaching downward, and a close that says, without any ambiguity: the sellers gave everything they had, and it wasn't enough.
That's the hammer. And once you learn to trust it, you'll never look at a chart quite the same way again.
Topics
Trading Myths

Beginner Trading

Technical Analysis

Market Education

Risk Management