The Inverted Hammer Candlestick Explained

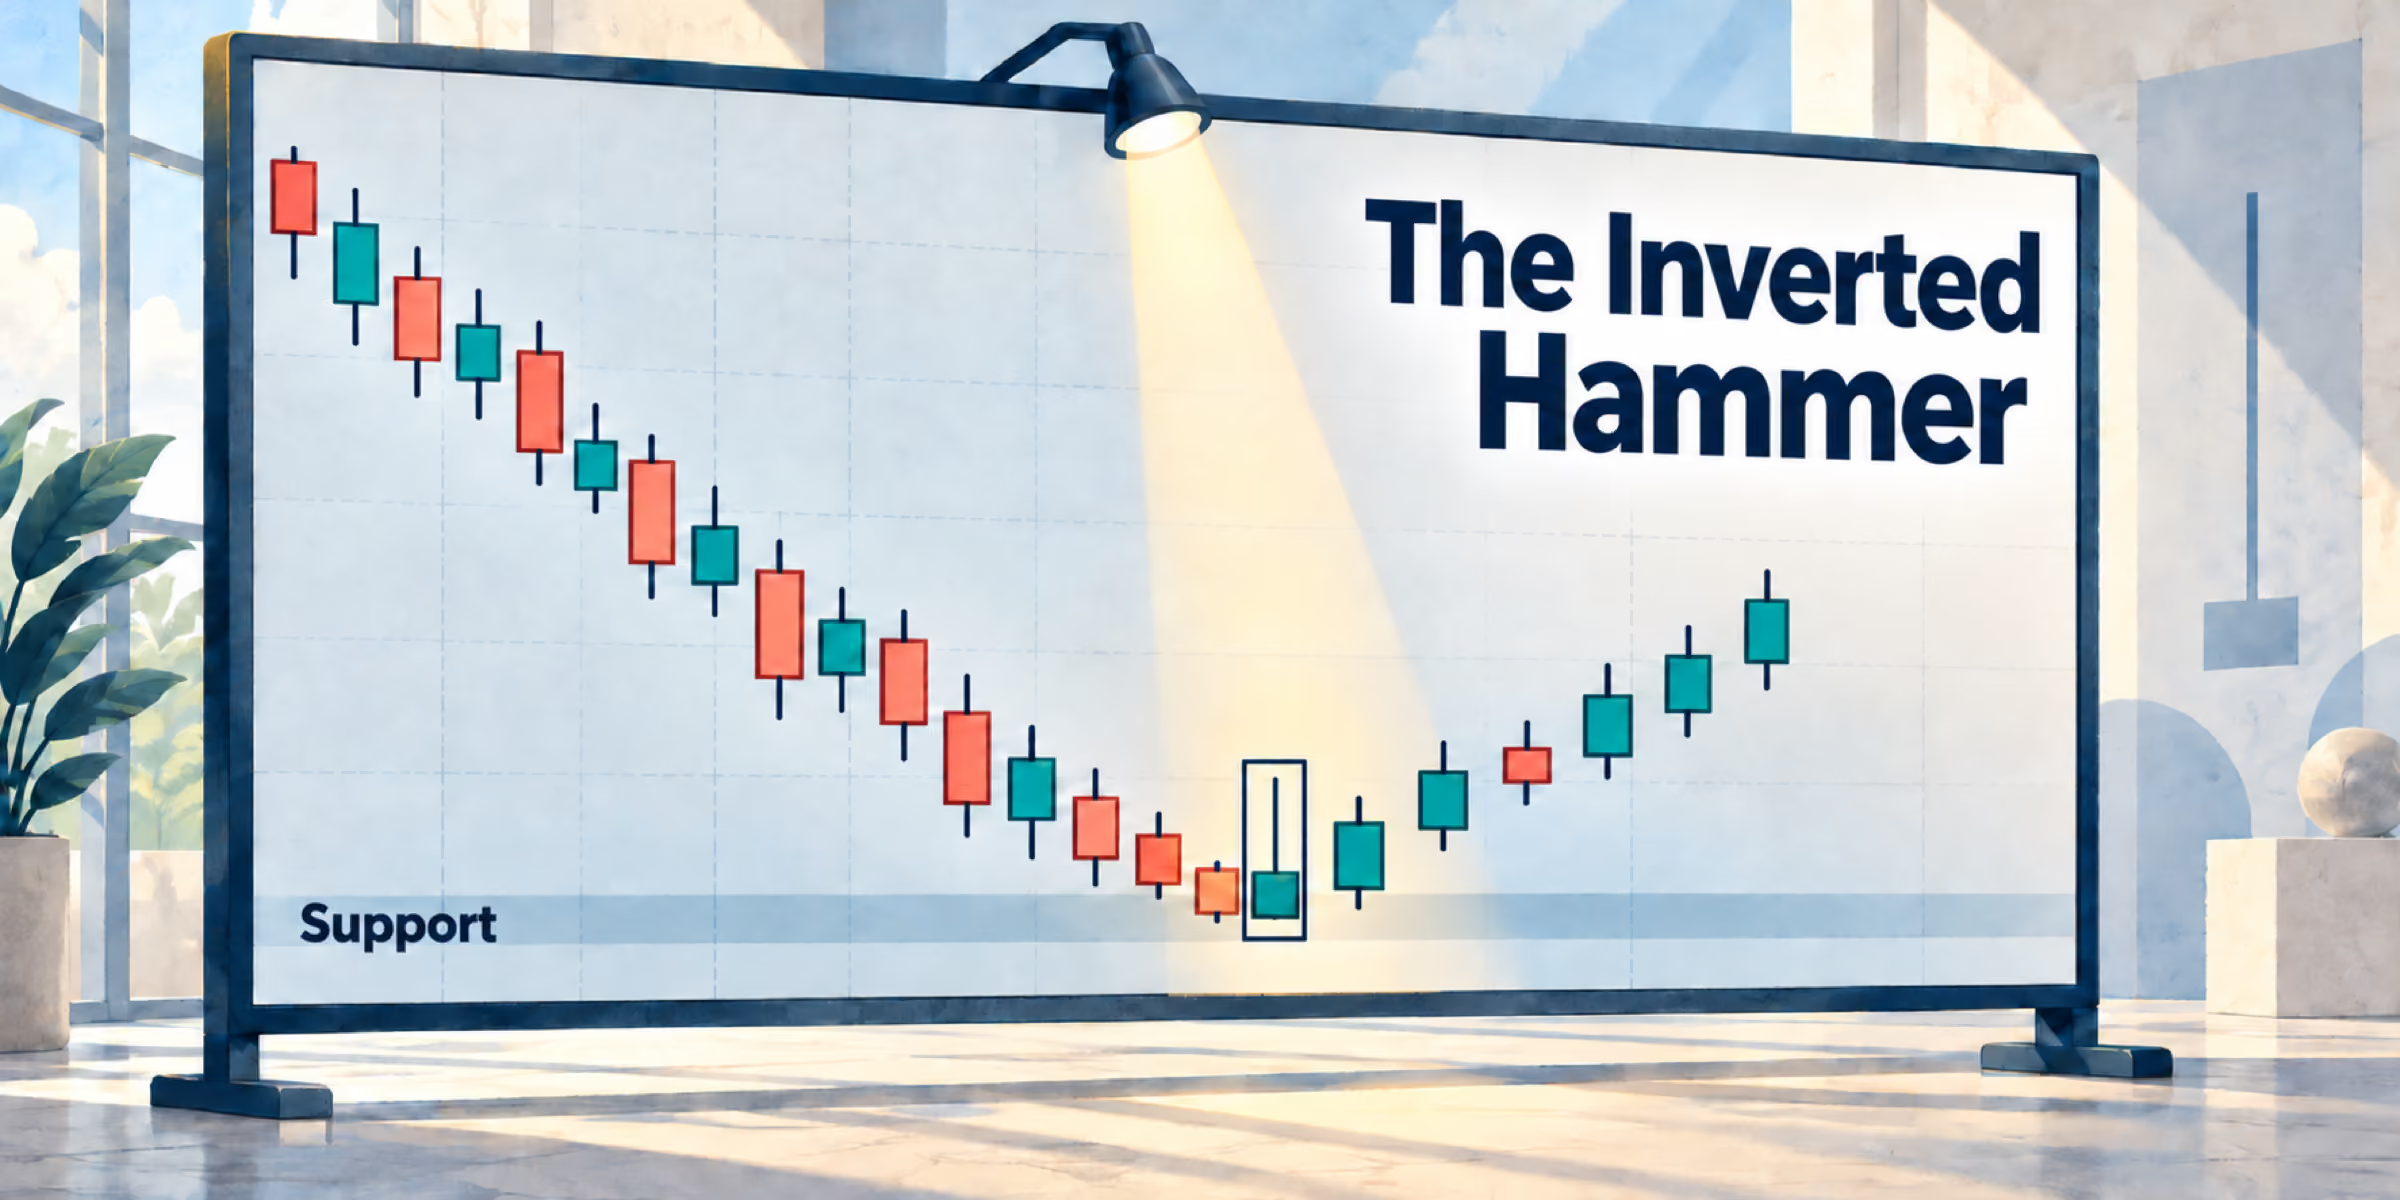
The Inverted Hammer Candlestick: A Reversal Signal Worth Waiting For
If you've spent any time studying candlestick charts, you already know that the market tells its story one candle at a time. Every session has an open, a high, a low, and a close — and when you learn to read those four data points together, you stop seeing random price movement and start seeing something much more useful: the tug of war between buyers and sellers, playing out in real time.
In the previous article, we covered the hammer candlestick — a pattern that forms when buyers aggressively push back from the lows and close the session near where it opened, leaving behind that iconic long lower wick. Today, we're looking at its close cousin: the inverted hammer. Same category, different shape, same underlying message — and once you understand what it's telling you, it becomes one of the more interesting reversal signals you'll encounter on a chart.
What Does an Inverted Hammer Look Like?
The name gives it away, really. Take everything you know about the regular hammer, flip it upside down, and you've got the basic visual. Instead of a long wick extending downward, the inverted hammer has a long upper shadow — usually at least twice the length of the body — with a small real body sitting near the bottom of the candle's range. There's little to no lower wick to speak of.

When you spot it on a chart, it looks almost like a candle that tried to rally hard during the session, shot upward with conviction, and then gave most of those gains back before the close. The body stays low, the wick reaches high, and the whole thing looks a bit like an upside-down lollipop or, true to its name, a hammer with the handle pointing up.
It's a single-candle pattern as well, which keeps things simple. You don't need to wait for a sequence of candles to unfold or try to count which session is the third or fourth in a row. One candle, one session, and the market has already made its statement.
That said, what the statement actually means depends entirely on context — and that's where most traders either get it right or get burned.
Context Is Everything: Why Location Matters
Here's the thing about the inverted hammer — it can appear anywhere on a chart the same way the regular hammer does. Scroll through enough price history, and you'll find candles with long upper wicks scattered all over the place, in uptrends, downtrends, and sideways markets alike. The shape on its own doesn't mean much. What matters is where it shows up.
The inverted hammer is a bullish reversal pattern, and it carries real weight only when it appears at the bottom of a downtrend, ideally near or within a strong support zone. That's the context that transforms it from a random candle into a meaningful signal.

Think about why that is. Support zones are areas where buyers have historically shown up in force — price levels where demand tends to outweigh supply. When the market has been falling, and the price finally reaches one of these zones, the dynamics begin to shift. Sellers who've been in control start running out of steam. Buyers who've been waiting for a favorable entry point start stepping in. And it's right at that inflection point — that moment of transition — where the inverted hammer tends to appear.
Without a nearby support zone, the pattern loses much of its predictive power. You're just looking at a wick on a candle, not a meaningful battle between bulls and bears at a level that matters. Always place the pattern in its proper context before drawing any conclusions.
What's Actually Happening Inside That Candle
The shape of the inverted hammer isn't random — it's the direct result of a very specific sequence of events during the trading session. Understanding that sequence is what makes the pattern click.
The session opens, and at first, nothing feels different. Sellers are still in control — they've been driving price lower for days, maybe weeks, and the bearish momentum hasn't fully let up yet. Price starts to drift down, or at best holds flat near the open.
But then something shifts. Buyers begin stepping in. It may be institutional money recognizing value at this price level. Maybe it's retail traders who've been watching support hold and decide now is the time. Whatever the reason, buying pressure builds — and the price starts moving up. Not just a little, but significantly. That upward push is what creates the long upper wick on the inverted hammer. For a period during that session, the bulls were genuinely in charge, driving price well above where the day began.
And then the sellers push back.
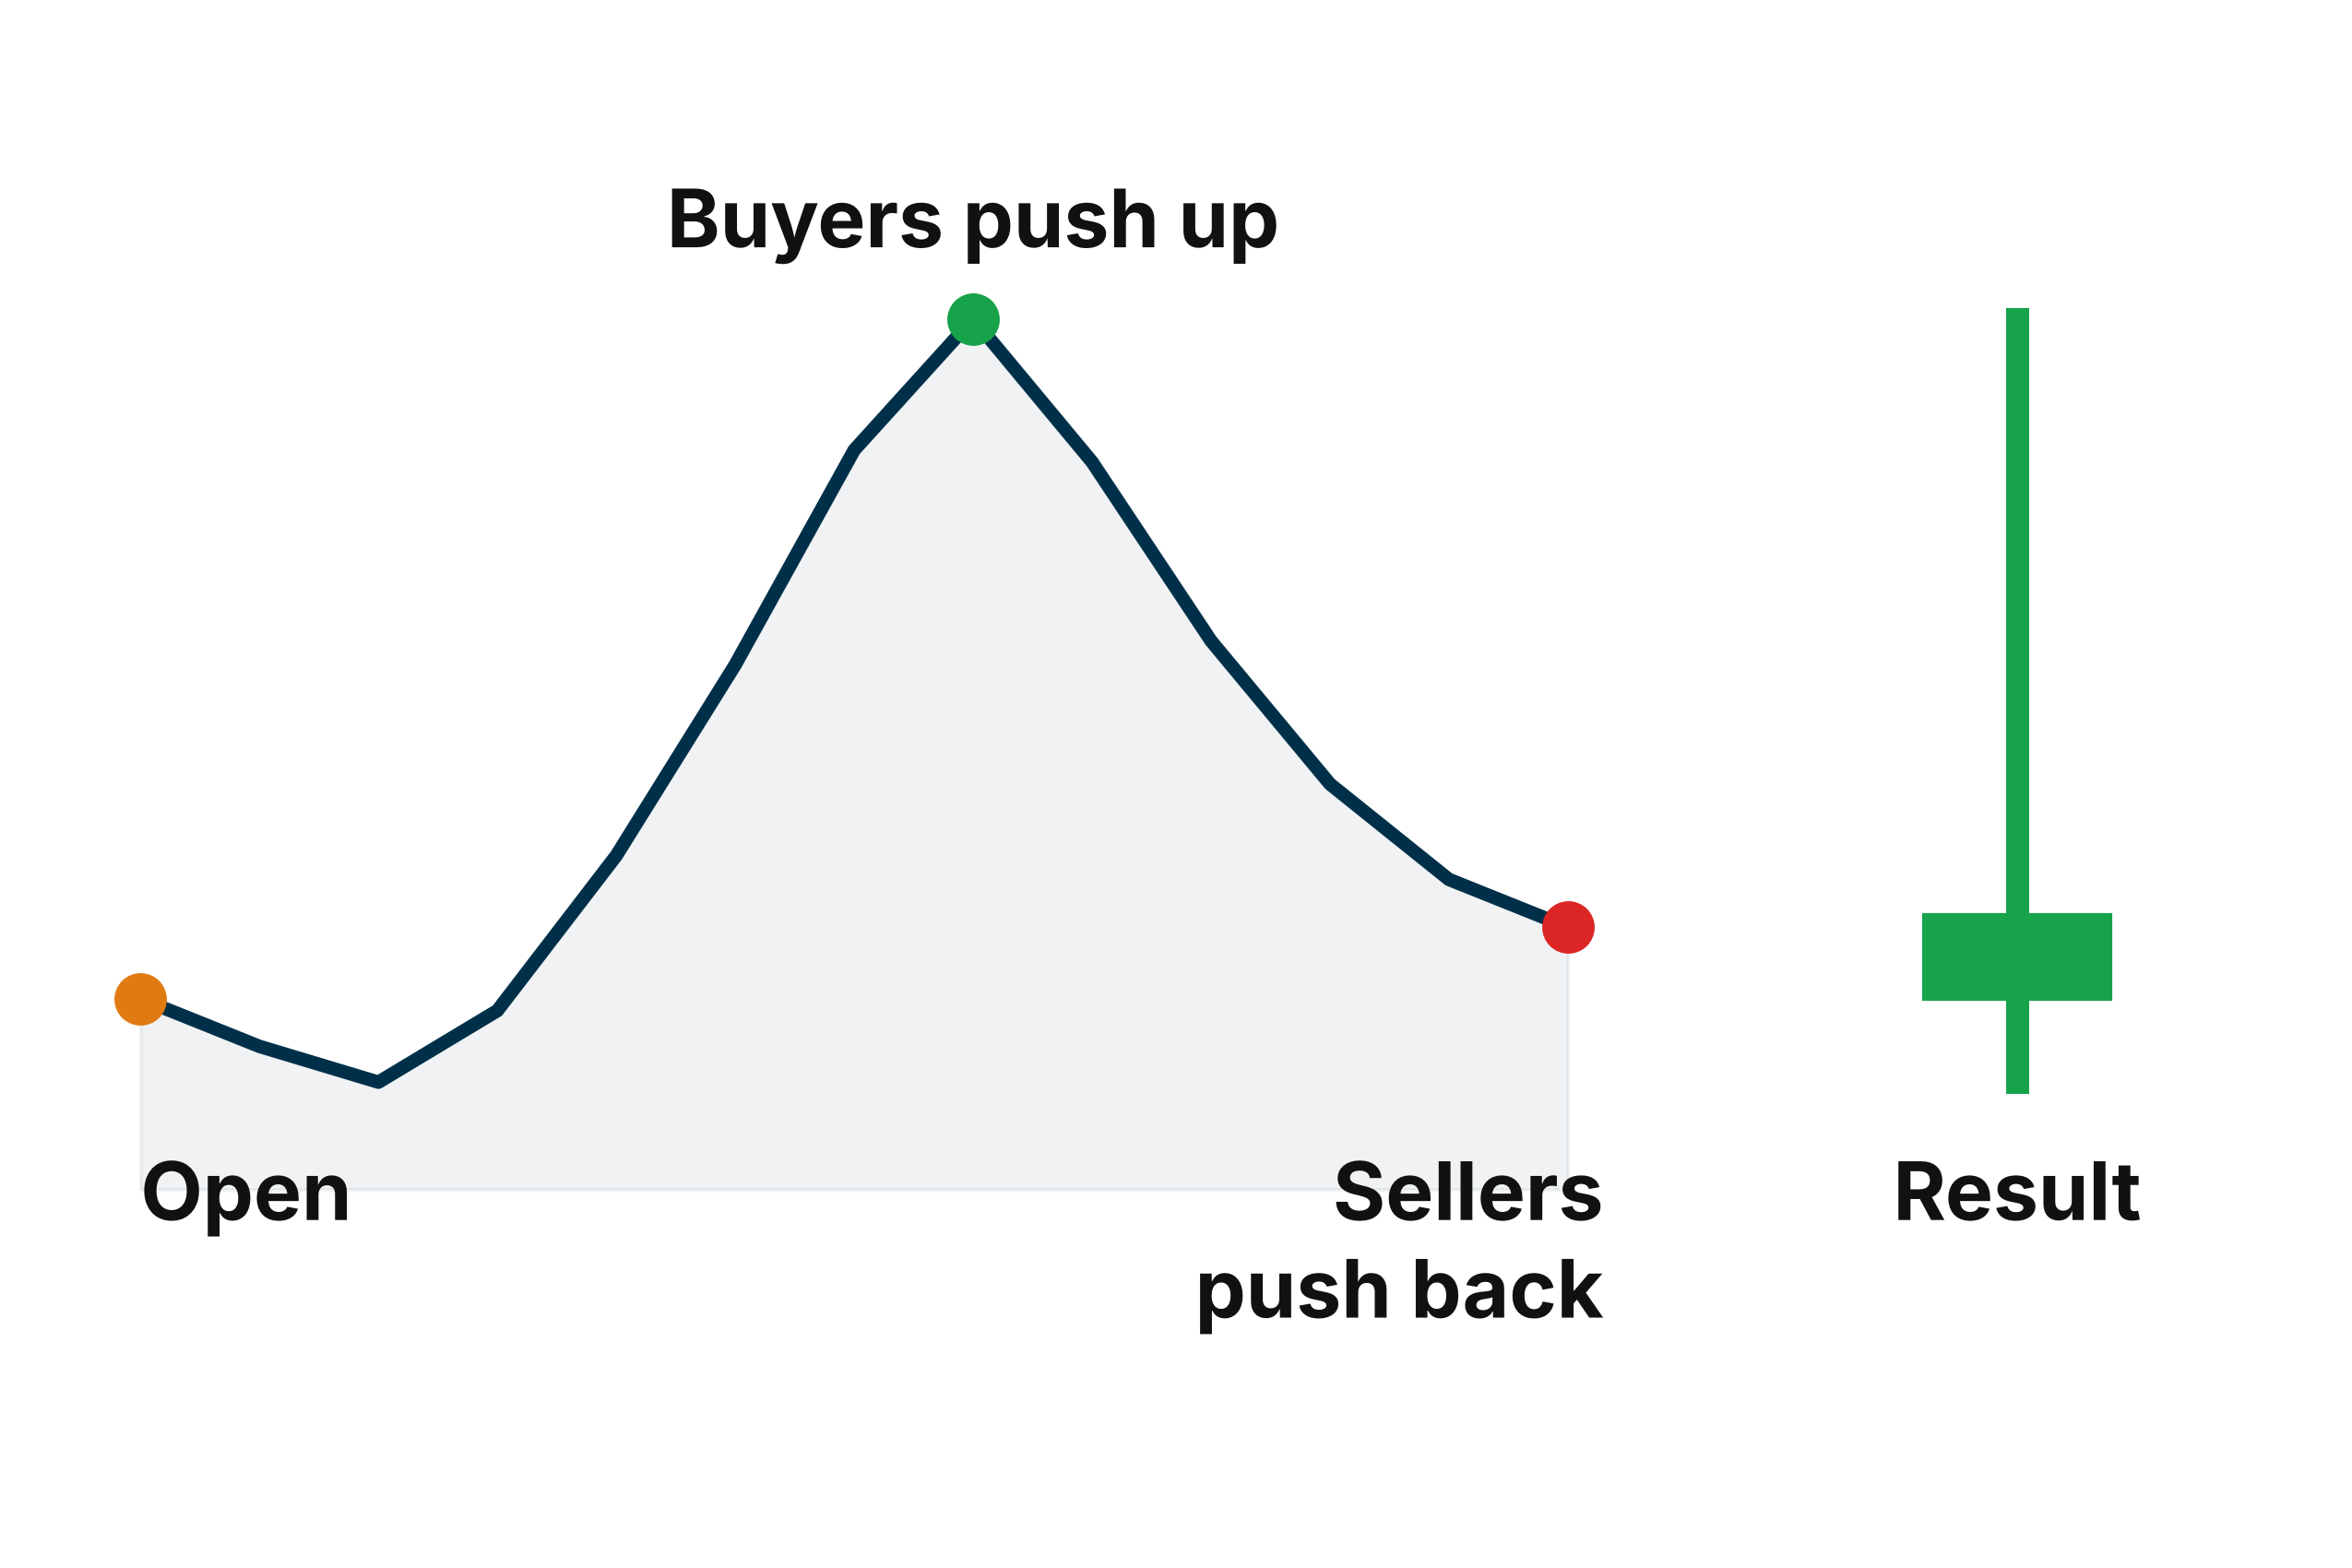
By the time the session closes, the price has come back down, settling near or just slightly above the opening level. The wick tells you how high buyers got; the body tells you where things ended up. The sellers clawed back most of the ground they lost — but they didn't fully win, either. The close is still near the open, and in some cases, slightly above it.
Here's where the color of the body becomes relevant. A green (bullish) body — meaning the price closed above the open — is a stronger signal than a red one. It shows that despite all the selling pressure during the session, buyers still managed to finish ahead. It's a small detail, but in candlestick analysis, every detail matters.

What the overall candle communicates is this: buyers are testing the market. They're probing upward, signaling that they have enough conviction to push prices higher. The sellers fought back and recovered much of the ground, yes — but the fact that buyers stepped up at all, in the context of a downtrend, is meaningful. It suggests the selling pressure is beginning to fade, and a reversal pressure could be building.
The Critical Difference: Warning vs. Confirmation
This is the part that separates traders who use the inverted hammer well from those who get caught on the wrong side. The pattern is a warning sign, not a confirmation. Read that again, because it matters.
Unlike the standard hammer — where the powerful close near the open is itself a strong bullish statement — the inverted hammer leaves things a bit more unresolved. The buyers tried, the sellers pushed back, and the result was inconclusive. The wick says the bulls were there. The body says the bears held their ground. Who actually wins that battle gets decided in the next session.
That's why confirmation is so important with this pattern. You're looking for the candle that follows the inverted hammer to close above the inverted hammer's high. That's the moment when the bullish case gets validated — when you can say with more confidence that the buyers have taken control and the downtrend is losing its grip.
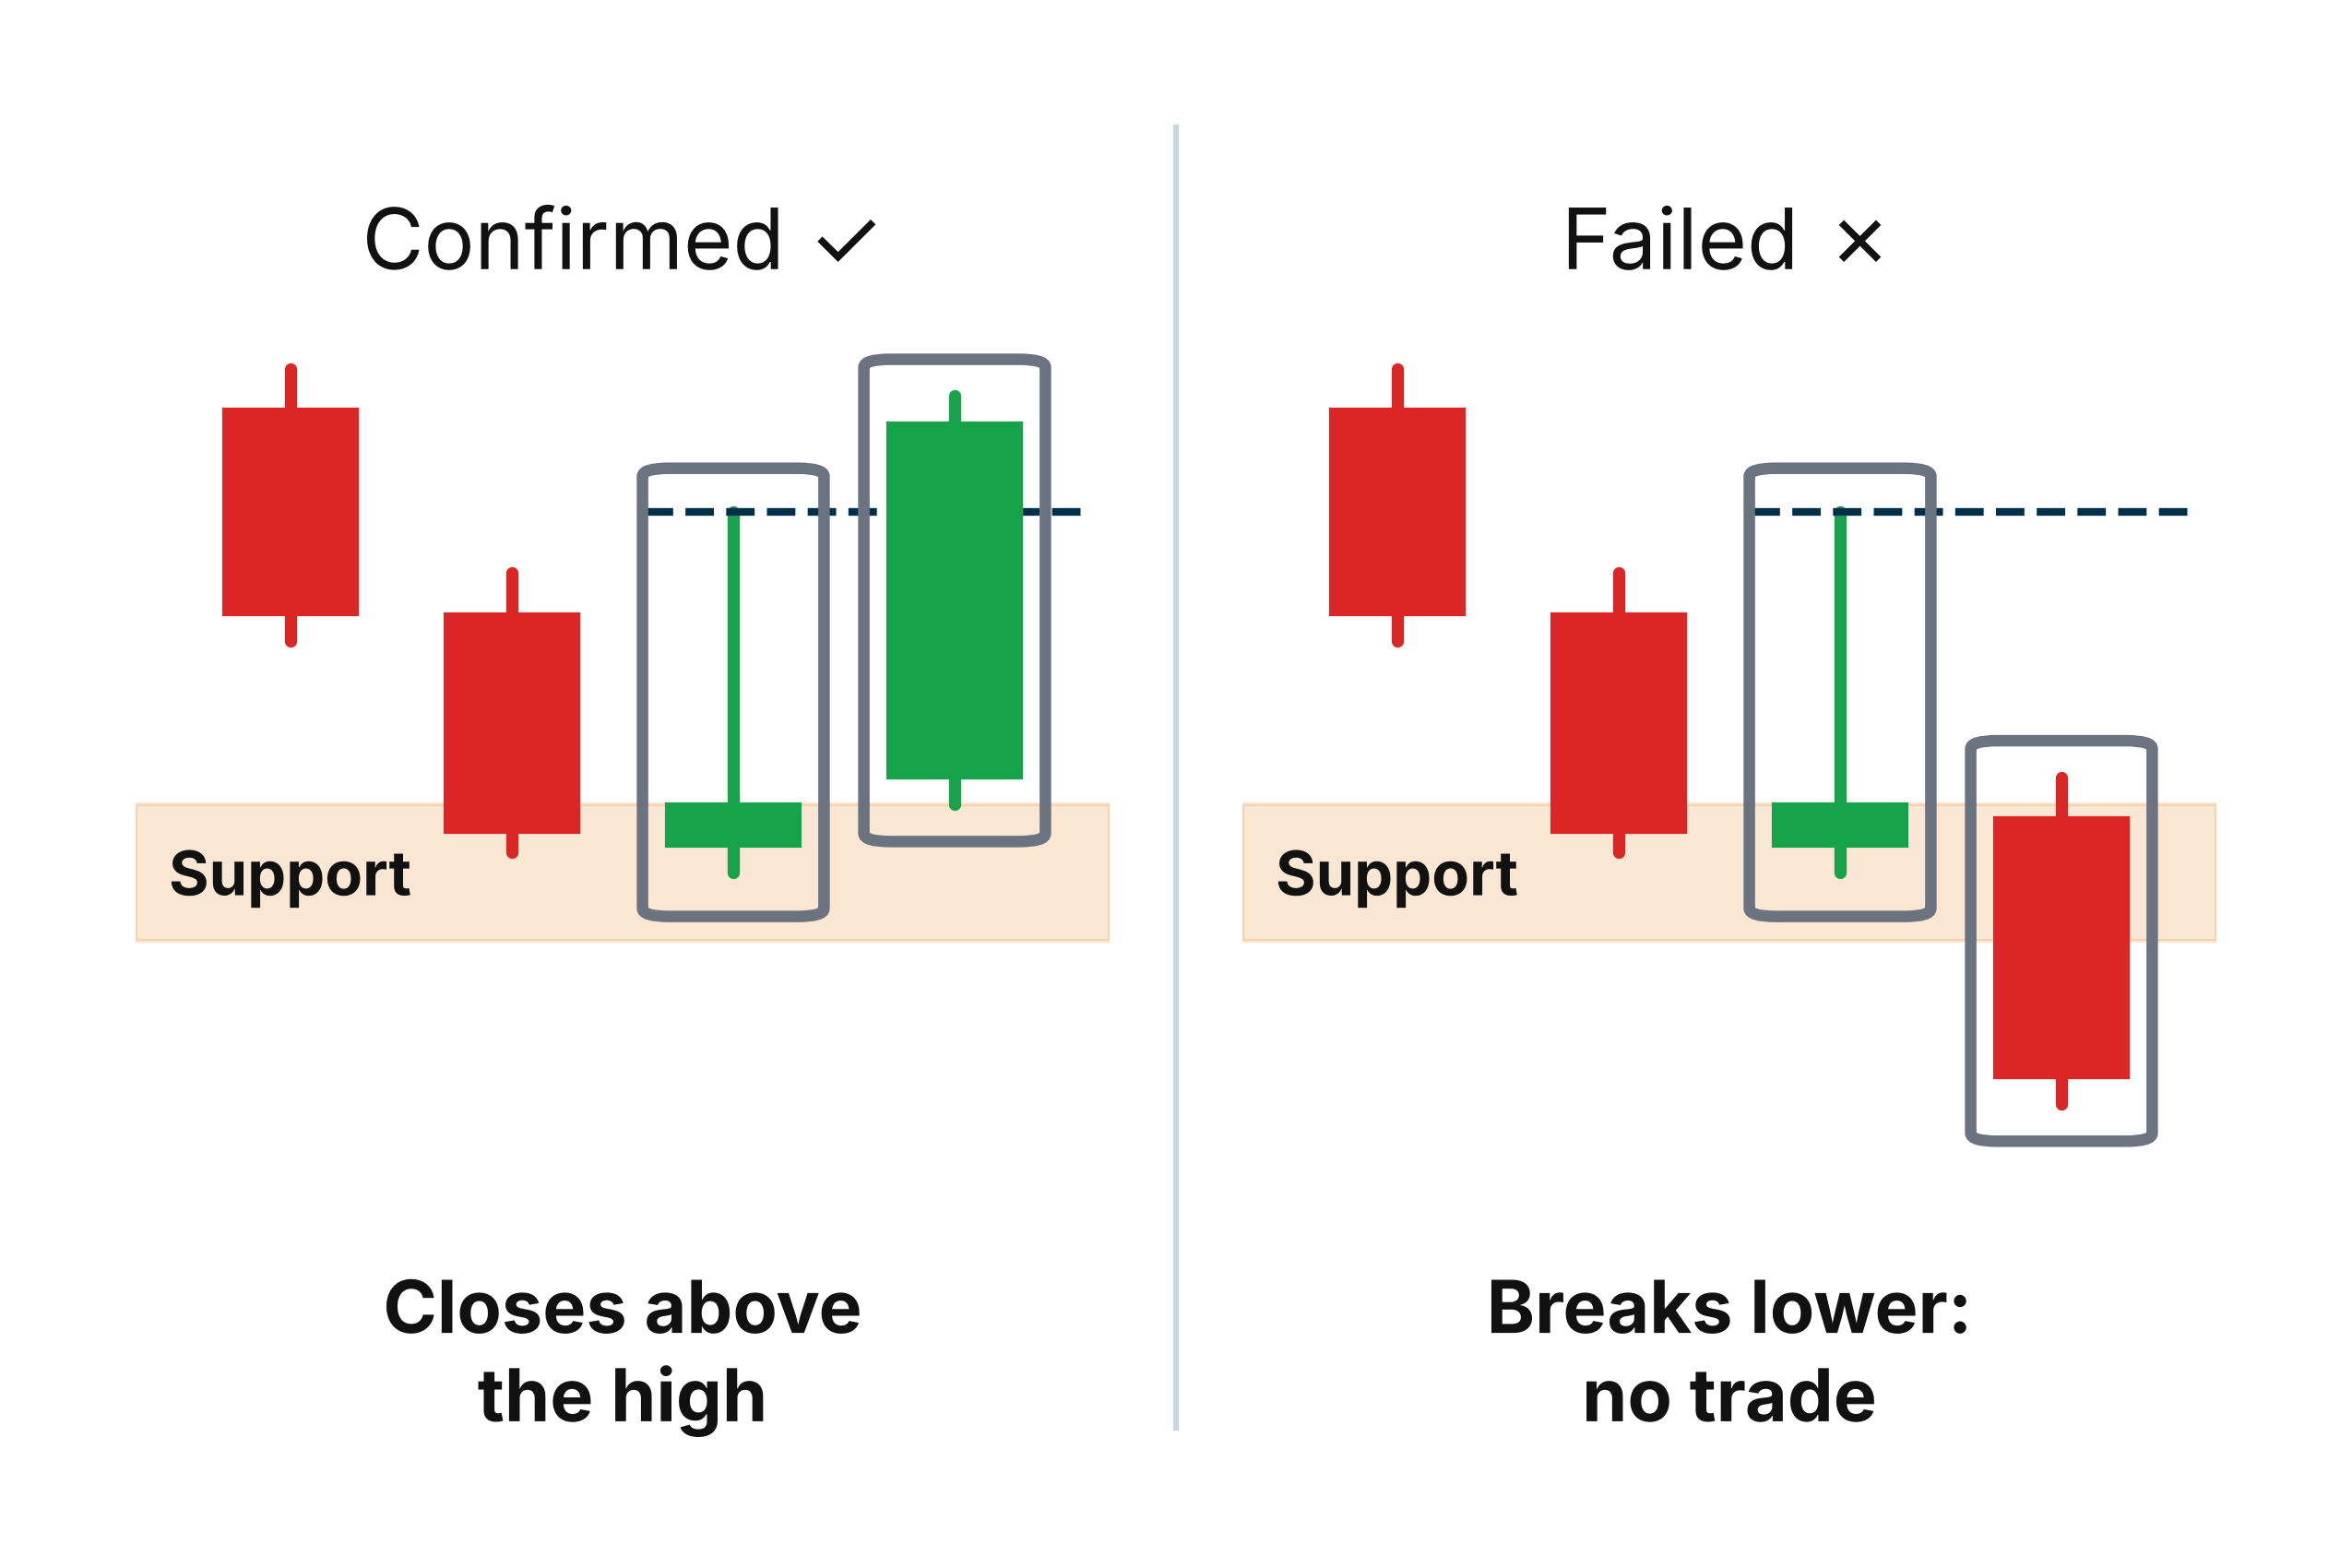
Entering a trade before that confirmation is essentially gambling on a signal that hasn't fully formed. Waiting for it means you might miss a few points off the low, but you're trading with evidence rather than hope — and that's a trade-off worth making every time.
What Makes the Signal Stronger
Not all inverted hammers are created equal. Some form in isolation with no additional supporting factors. Others arrive stacked with confirmation from multiple sources — and those are the setups worth getting genuinely excited about.
Three things can significantly boost the reliability of an inverted hammer signal.
The first, as already discussed, is location — a well-established support zone gives the pattern a reason to matter.
The second is volume. When the inverted hammer forms on notably higher-than-average trading volume, it suggests more market participants were involved in that session. More buyers stepping in at support isn't just a candle pattern at that point — it's a visible surge of interest that confirms real conviction behind the move.
The third factor is alignment with other technical indicators. Tools like the RSI (Relative Strength Index) or the MACD can add another layer of context. If the RSI is showing oversold conditions at the same time an inverted hammer forms at support, you now have two independent signals pointing in the same direction. That kind of alignment doesn't guarantee anything, but it significantly stacks the odds in your favor.

Don't Confuse It With the Shooting Star
Before moving on to the actual trading approach, there's one common mix-up worth clearing up. The inverted hammer and the shooting star look nearly identical — both feature a small body and a long upper wick. But their meaning is completely opposite, and confusing the two can make you trade in the wrong direction.
The inverted hammer is a bullish pattern. It appears at the bottom of a downtrend, near support, and signals that buyers may be stepping in. The shooting star is a bearish pattern. It appears at the top of an uptrend, near resistance, and signals that sellers may be taking over. Same shape, mirror-image context, completely different implication.

The easiest way to tell them apart is to look at where the candle appears in the broader trend. Bottom of a move near support — you're looking at an inverted hammer. Top of a move near resistance — that's a shooting star. Context, once again, is everything.
How to Actually Trade It
Knowing what the inverted hammer means is one thing. Knowing how to translate that into an actual trade is another. Here's a clean, disciplined approach that protects you from acting on false signals while still letting you catch the move when it's real.
Start by identifying your support zones before anything else. When the price is falling, mark out the key levels where buyers have historically stepped in. These are the areas where an inverted hammer becomes worth watching. Without a nearby support zone, move on — the setup isn't there.
Once an inverted hammer forms inside that support zone, your job is to wait. Don't jump in during the candle or right at the close. Watch what the next session does. If the following candle closes above the high of the inverted hammer, that's your confirmation — the bulls have followed through, and the pattern has done what it promised.
Enter the trade only after that confirmation is real. Place your stop-loss just below the low of the inverted hammer. If you prefer to give the trade a bit more breathing room, placing it below the broader support zone is a reasonable alternative for more conservative traders. For your target, aim for the next significant resistance level above, or structure the trade around a 3:1 reward-to-risk ratio — meaning you're looking to make at least three times what you're risking if the trade goes against you.
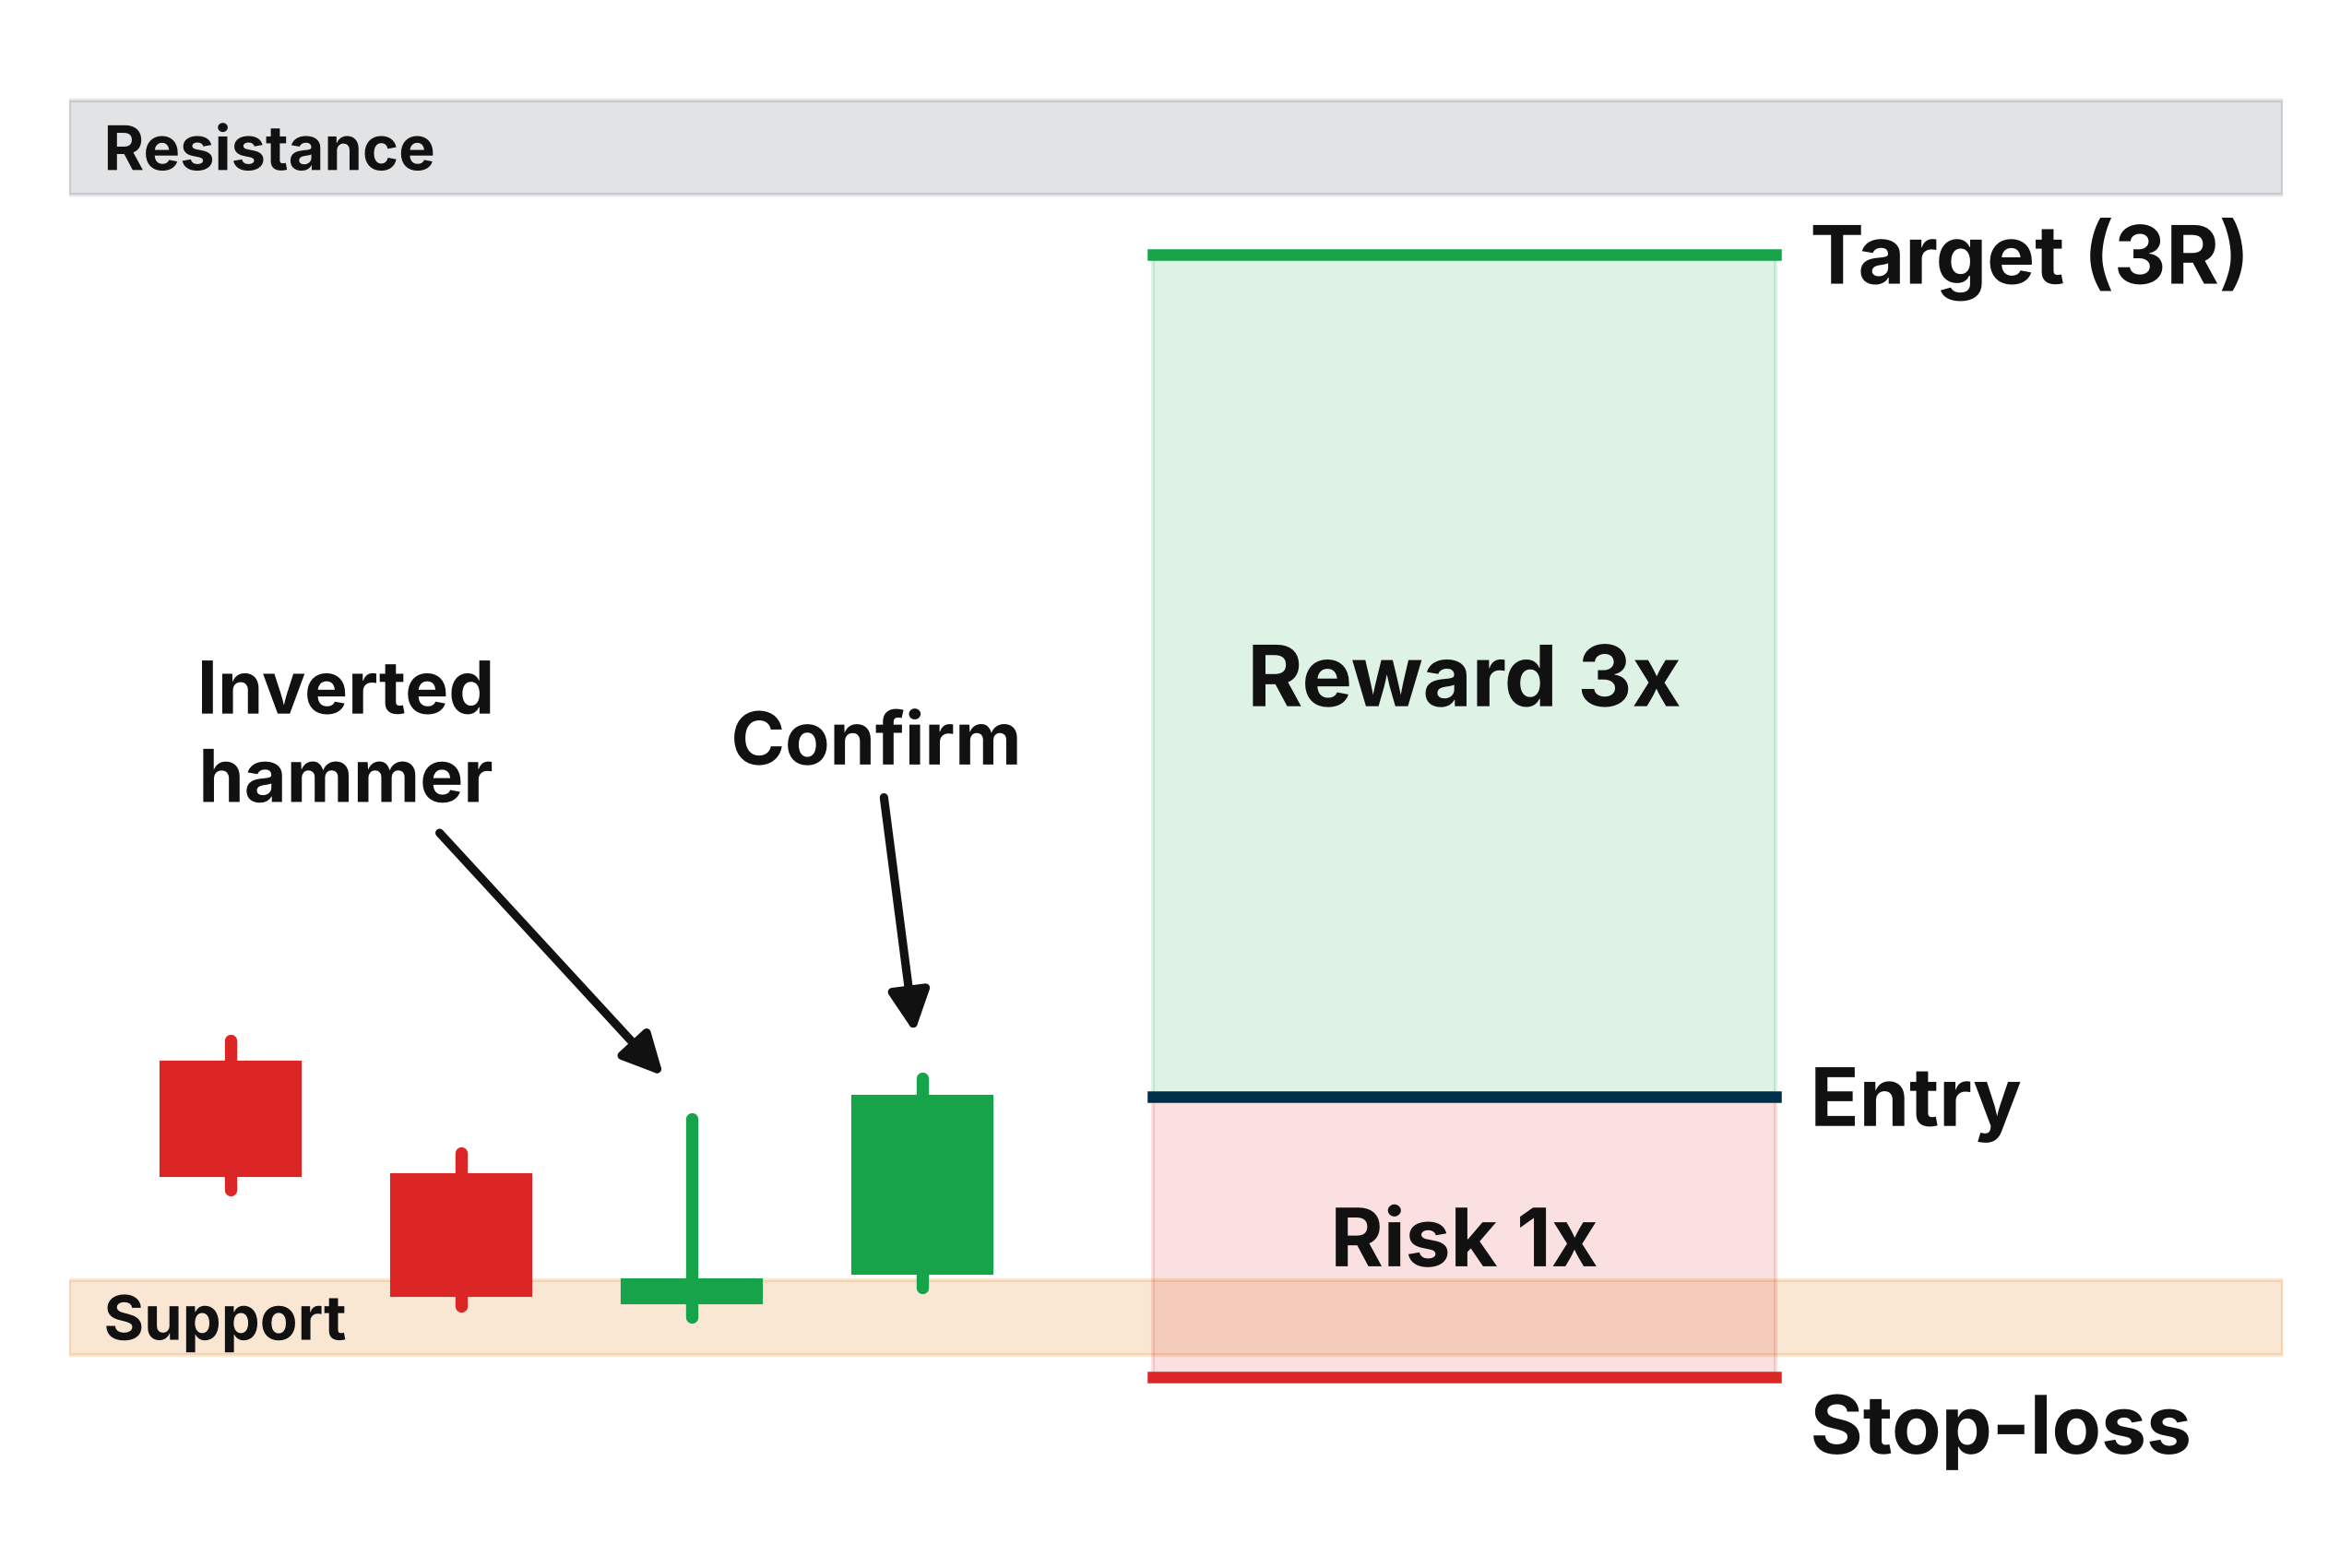
This approach won't get you in at the absolute low every time. But it will keep you out of trades that look good on the surface and fail to follow through — which, over the long run, matters far more than squeezing out a few extra points on any individual trade.
Final Thoughts: Patience Is the Real Edge
The inverted hammer is a fascinating pattern precisely because it captures a moment of transition — that uncertain, in-between moment when a downtrend hasn't quite ended yet, but the first cracks are starting to show. Buyers are testing the water. Sellers are losing their conviction. The market is deciding which direction it wants to go next.
What makes traders successful with this pattern isn't just the ability to recognize it on a chart. It's the discipline to wait — to let the confirmation candle close, to let the pattern complete its story before committing capital. The inverted hammer shows you where the potential turning point might be. The confirmation candle tells you it actually is.
Trading is full of setups that look promising and go nowhere. It's also full of setups that seem too obvious to be real, yet run for days. The difference between the two is rarely the pattern itself — it's the patience to wait for the market to show its hand before you show yours.
The inverted hammer teaches that lesson well. Spot it in the right place, wait for confirmation, manage your risk, and let the trade work. Do that consistently, and one small candle with a long upper wick can become one of the more reliable tools in your entire playbook.
Topics

Trading Myths

Beginner Trading

Technical Analysis

Market Education

Risk Management